IBM 2011 Annual Report Download - page 33
Download and view the complete annual report
Please find page 33 of the 2011 IBM annual report below. You can navigate through the pages in the report by either clicking on the pages listed below, or by using the keyword search tool below to find specific information within the annual report.-
 1
1 -
2
-
3
-
4
-
5
-
6
-
7
-
8
-
9
-
10
-
11
-
12
-
13
-
14
-
15
-
16
-
17
-
18
-
19
-
20
-
21
-
22
-
 23
23 -
 24
24 -
 25
25 -
 26
26 -
 27
27 -
 28
28 -
 29
29 -
 30
30 -
 31
31 -
 32
32 -
 33
33 -
 34
34 -
 35
35 -
 36
36 -
 37
37 -
 38
38 -
 39
39 -
 40
40 -
 41
41 -
 42
42 -
 43
43 -
44
-
45
-
46
-
47
-
48
-
49
-
50
-
51
-
52
-
53
-
54
-
55
-
56
-
57
-
58
-
59
-
60
-
61
-
62
-
63
-
64
-
65
-
66
-
67
-
68
-
69
-
70
-
71
-
72
-
73
-
74
-
75
-
76
-
77
-
78
-
79
-
80
-
81
-
82
-
83
-
84
-
85
-
86
-
87
-
88
-
89
-
90
-
91
-
92
-
93
-
94
-
95
-
96
-
97
-
98
-
99
-
100
-
101
-
102
-
103
-
104
-
105
-
106
-
107
-
108
-
109
-
110
-
111
-
112
-
113
-
114
-
115
-
116
-
117
-
118
-
119
-
120
-
121
-
122
-
123
-
124
-
125
-
126
-
127
-
128
-
129
-
130
-
131
-
132
-
133
-
134
-
135
-
136
-
137
-
138
-
139
-
140
-
141
-
142
-
143
-
144
-
145
-
146
-
147
-
148
 |
 |

31
Management Discussion
International Business Machines Corporation and Subsidiary Companies
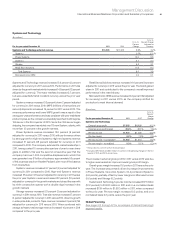
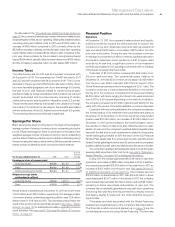
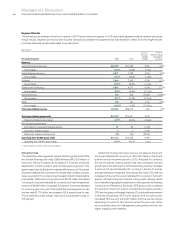
Systems and Technology
($ in millions)
For the year ended December 31: 2011 2010
Yr.-to-Yr.
Percent
Change
Yr.-to-Yr.
Percent Change
Adjusted for
Currency
Systems and Technology external revenue $18,985 $17,973 5.6%3.2%
System z 0.3%(2.1)%
Power Systems 12.0 9.5
System x 5.7 2.4
Storage 5.8 3.1
Retail Store Solutions 11.6 9.4
Total Systems 6.5 3.8
Microelectronics OEM 0.2 0.1
Systems and Technology revenue increased 5.6 percent (3 percent
adjusted for currency) in 2011 versus 2010. Performance in 2011 was
driven by the growth markets which increased 14.9 percent (12 percent
adjusted for currency). The major markets increased 2.7 percent,
but were essentially flat at constant currency versus the prior year
period.
System z revenue increased 0.3 percent (down 2 percent adjusted
for currency) in 2011 versus 2010. MIPS (millions of instructions per
second) shipments increased 16 percent in 2011 versus 2010. The
revenue performance and lower MIPS growth was a result of the
strong prior-year performance and was consistent with prior mainframe
product cycles, as the company successfully launched its zEnterprise
196 server in the third quarter of 2010. Since the z196 server began
shipping, the company has added over 115 new System z clients, with
more than 33 percent in the growth markets.
Power Systems revenue increased 12.0 percent (9 percent
adjusted for currency) in 2011 versus 2010 with performance driven
by strong growth in high-end systems. High-end systems revenue
increased 31 percent (28 percent adjusted for currency) in 2011
compared to 2010. The company extended its market leadership in
2011, having posted 15 consecutive quarters of year-to-year share
gains. In addition, this was the second consecutive year that the
company had over 1,000 competitive displacements, which this
year generated over $1 billion of business; approximately 50 percent
of this business was from Hewlett Packard, with most of the balance
from Oracle/Sun.
System x revenue increased 5.7 percent (2 percent adjusted for
currency) in 2011 compared to 2010. High-end System x revenue
increased 35 percent (31 percent adjusted for currency) in 2011 versus
the prior year. System x revenue increased 22 percent (18 percent
adjusted for currency) in the growth markets and closed the year with
its ninth consecutive quarter with a double-digit increase in the
growth markets.
Storage revenue increased 5.8 percent (3 percent adjusted for
currency) in 2011 versus 2010. Total disk revenue increased 7 percent
(4 percent adjusted for currency) in 2011 versus 2010, driven by growth
in enterprise disk products. Tape revenue increased 3 percent (flat
adjusted for currency) in 2011 versus 2010. When combined with
storage software, total storage revenue increased 10 percent in 2011
compared to the prior year.
Retail Stores Solutions revenue increased 11.6 percent (9 percent
adjusted for currency) in 2011 versus the prior year. The brand gained
share in 2011 and contributed to the company’s overall improved
performance in the retail industry.
Microelectronics OEM revenue increased 0.2 percent (flat adjusted
for currency) in 2011 versus 2010, as the company shifted its
production to meet internal demand.
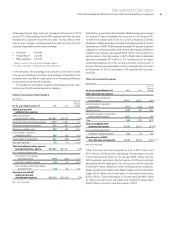
($ in millions)
For the year ended December 31: 2011 2010*
Yr.-to-Yr.
Percent/
Margin
Change
Systems and Technology
External gross profit $7,555 $6,856 10.2%
External gross profit margin 39.8% 38.1% 1.6 pts.
Pre-tax income $1,633 $1,456 12.2%
Pre-tax margin 8.2% 7.8% 0.5 pts.
Pre-tax income—normalized** $1,652 $1,513 9.2%
Pre-tax margin—normalized 8.3% 8.1% 0.3 pts.
* Reclassified to conform with 2011 presentation.
**
Excludes $19 million and $57 million of workforce rebalancing charges in the first
quarter of 2011 and 2010, respectively.
The increase in external gross profit for 2011 versus 2010 was due
to higher revenue and an improved overall gross profit margin.
Overall gross margin increased 1.6 points in 2011 versus the prior
year. The increase was primarily driven by margin improvements
in Power Systems (1.2 points), System z (0.4 points) and System x
(0.6 points), partially offset by lower margins in Microelectronics
(0.6 points) and Storage (0.2 points).
Systems and Technology’s pre-tax income increased $177 million
(12.2 percent) to $1,633 million in 2011 and on a normalized basis
increased $139 million to $1,652 million in 2011, when compared
to the prior year. Pre-tax margin increased 0.5 points, and on a
normalized basis 0.3 points, versus the prior year.
Global Financing
See pages 63 through 67 for an analysis of Global Financing’s
segment results.