IBM 2011 Annual Report Download - page 38
Download and view the complete annual report
Please find page 38 of the 2011 IBM annual report below. You can navigate through the pages in the report by either clicking on the pages listed below, or by using the keyword search tool below to find specific information within the annual report.-
 1
1 -
2
-
3
-
4
-
5
-
6
-
7
-
8
-
9
-
10
-
11
-
12
-
13
-
14
-
15
-
16
-
17
-
18
-
19
-
20
-
21
-
22
-
23
-
24
-
25
-
26
-
27
-
 28
28 -
 29
29 -
 30
30 -
 31
31 -
 32
32 -
 33
33 -
 34
34 -
 35
35 -
 36
36 -
 37
37 -
 38
38 -
 39
39 -
 40
40 -
 41
41 -
 42
42 -
 43
43 -
 44
44 -
 45
45 -
 46
46 -
 47
47 -
 48
48 -
49
-
50
-
51
-
52
-
53
-
54
-
55
-
56
-
57
-
58
-
59
-
60
-
61
-
62
-
63
-
64
-
65
-
66
-
67
-
68
-
69
-
70
-
71
-
72
-
73
-
74
-
75
-
76
-
77
-
78
-
79
-
80
-
81
-
82
-
83
-
84
-
85
-
86
-
87
-
88
-
89
-
90
-
91
-
92
-
93
-
94
-
95
-
96
-
97
-
98
-
99
-
100
-
101
-
102
-
103
-
104
-
105
-
106
-
107
-
108
-
109
-
110
-
111
-
112
-
113
-
114
-
115
-
116
-
117
-
118
-
119
-
120
-
121
-
122
-
123
-
124
-
125
-
126
-
127
-
128
-
129
-
130
-
131
-
132
-
133
-
134
-
135
-
136
-
137
-
138
-
139
-
140
-
141
-
142
-
143
-
144
-
145
-
146
-
147
-
148
 |
 |

36
Management Discussion
International Business Machines Corporation and Subsidiary Companies
appearing in the separate Global Financing section, beginning on
page 63, are supplementary data presented to facilitate an
understanding of the Global Financing business.
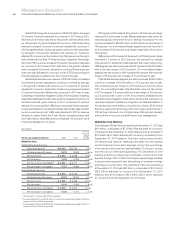
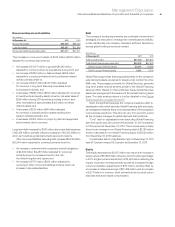
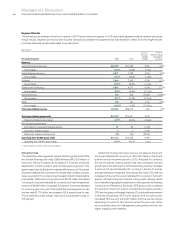
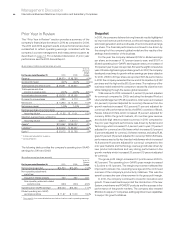
Working Capital
($ in millions)
At December 31: 2011 2010
Current assets $50,928 $48,116
Current liabilities 42,123 40,562
Working capital $ 8,805 $ 7,554
Current ratio 1.21:1 1.19:1
Working capital increased $1,251 million from the year-end 2010
position. The key changes are described below:
Current assets increased $2,812 million ($3,734 million adjusted
for currency), due to:
• An increase of $1,337 million ($1,594 million adjusted
for currency) in short-term receivables due to:
– Higher volumes of financing receivables of $644 million
($789 million adjusted for currency) driven by customer
loans and inventory financing; and
– Higher software sales volumes of approximately
$300 million, and
– Reclasses of approximately $300 million of long-term
other receivables to reflect maturity dates.
• An increase of $1,022 million ($1,181 million adjusted for
currency) in prepaid expenses and other current assets
primarily due to:
– An increase of $387 million in collateral received related
to derivatives valuations; and
– An increase of $326 million in income taxes primarily driven
by tax payments in the U.S.; and
– An increase of $310 million in various prepaid expenses; and
• An increase of $1,262 million ($1,755 million adjusted
for currency) in cash and cash equivalents (see the following
cash flow analysis); partially offset by
• A decline of $990 million in marketable securities due
to sales of securities during 2011.
Current liabilities increased $1,561 million ($1,779 million adjusted for
currency) as a result of:
• An increase in short-term debt of $1,685 million primarily
driven by:
– New debt issuances of $6,123 million including commercial
paper; and
– Reclasses of $4,325 million from long-term to short-term
debt to reflect maturity dates; partially offset by
– Payments of $8,910 million.
• An increase in accounts payable of $713 million ($766 million
adjusted for currency) reflecting higher year-end activity as
well as the increase in collateral related to derivatives; and
• An increase in deferred income of $617 million ($638 million
adjusted for currency) driven by the software business,
including acquisitions; partially offset by
• A decrease of $903 million in taxes payable primarily due
to tax payments in the U.S. during 2011; and
• A decrease in other accrued expenses and liabilities of
$621 million ($473 million adjusted for currency) primarily
due to derivatives valuations.
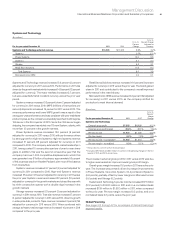
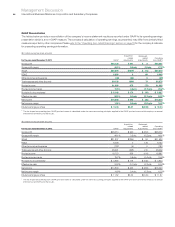
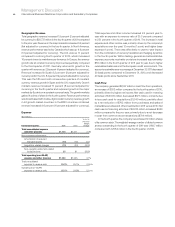
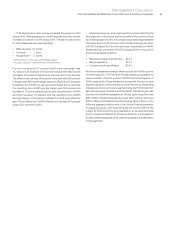
Cash Flow
The company’s cash flow from operating, investing and financing
activities, as reflected in the Consolidated Statement of Cash Flows
on page 73, is summarized in the table below. These amounts include
the cash flows associated with the Global Financing business.
($ in millions)
For the year ended December 31: 2011 2010
Net cash provided by/(used in)
Operating activities $ 19,846 $ 19,549
Investing activities (4,396) (8,507)
Financing activities (13,696) (12,429)
Effect of exchange rate changes
on cash and cash equivalents (493) (135)
Net change in cash and cash equivalents $ 1,262 $ (1,522)
Net cash from operating activities increased by $298 million in 2011
as compared to 2010 driven by the following key factors:
• Improved net income of $1,022 million; and
• A decrease in net gains on asset sales of $459 million, driven
by the PLM transaction gain in 2010; partially offset by
• A decrease in cash provided by operating assets and liabilities
of $1,152 million due to:
– Higher net tax payments of approximately $900 million
during 2011 compared to 2010; and
– A decrease in cash provided by receivables of $790 million
as a result of higher volumes in 2011; partially offset by
– A decrease in cash used related to retirement-related plans
of $196 million, primarily driven by lower non-U.S. employer
funding in 2011; and
– A decrease in cash used for workforce rebalancing activities
of $278 million during 2011 compared to 2010.
Net cash used in investing activities decreased $4,111 million due to
a decrease in cash used for acquisitions.
Net cash used in financing activities increased $1,267 million as
a result of:
• A net decrease of $991 million in cash from common
stock transactions; and
• An increase in dividends paid of $296 million in 2011
compared to 2010; partially offset by
• A decrease in common stock repurchases of $329 million
in 2011 compared to 2010.