IBM 2011 Annual Report Download - page 3
Download and view the complete annual report
Please find page 3 of the 2011 IBM annual report below. You can navigate through the pages in the report by either clicking on the pages listed below, or by using the keyword search tool below to find specific information within the annual report.-
 1
1 -
 2
2 -
 3
3 -
 4
4 -
 5
5 -
 6
6 -
 7
7 -
 8
8 -
 9
9 -
 10
10 -
 11
11 -
 12
12 -
 13
13 -
 14
14 -
15
-
16
-
17
-
18
-
19
-
20
-
21
-
22
-
23
-
24
-
25
-
26
-
27
-
28
-
29
-
30
-
31
-
32
-
33
-
34
-
35
-
36
-
37
-
38
-
39
-
40
-
41
-
42
-
43
-
44
-
45
-
46
-
47
-
48
-
49
-
50
-
51
-
52
-
53
-
54
-
55
-
56
-
57
-
58
-
59
-
60
-
61
-
62
-
63
-
64
-
65
-
66
-
67
-
68
-
69
-
70
-
71
-
72
-
73
-
74
-
75
-
76
-
77
-
78
-
79
-
80
-
81
-
82
-
83
-
84
-
85
-
86
-
87
-
88
-
89
-
90
-
91
-
92
-
93
-
94
-
95
-
96
-
97
-
98
-
99
-
100
-
101
-
102
-
103
-
104
-
105
-
106
-
107
-
108
-
109
-
110
-
111
-
112
-
113
-
114
-
115
-
116
-
117
-
118
-
119
-
120
-
121
-
122
-
123
-
124
-
125
-
126
-
127
-
128
-
129
-
130
-
131
-
132
-
133
-
134
-
135
-
136
-
137
-
138
-
139
-
140
-
141
-
142
-
143
-
144
-
145
-
146
-
147
-
148
 |
 |
1
I am pleased to report that IBM had
another strong year in 2011. Your
company continued to outperform
our industry and the market at large.
We capped IBM’s rst century by
achieving record revenue, prot,
free cash ow and earnings per share.
At the same time, we continued to
deliver superior returns to you, and we
are well positioned for future growth
in a globally integrating economy.
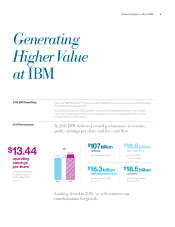
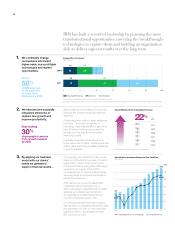
Revenue and income: Our revenue in 2011 was
$107 billion, up 7 percent. We grew operating pre-tax
income by 9 percent, to $21.6 billion, our highest ever.
Margins: IBM’s operating pre-tax income margin rose for
the ninth consecutive year
—
to 20.2 percent, up 10 points
since 2000. We achieved this by continuing to shift our
business mix to more protable segments and by driving
productivity. More than 90 percent of our segment prot
in 2011 was from software, services and nancing.
Earnings per share: We have continued to achieve
strong EPS growth. Last year was another record, with
diluted operating earnings per share of $13.44, up
15 percent. This marked nine straight years of double-
digit EPS growth.
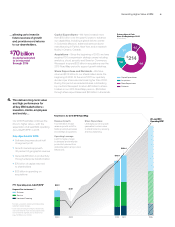
Cash ow: IBM has consistently generated strong
cash ow, a key indicator of real business performance.
In 2011 our free cash ow was $16.6 billion. We have
improved our free cash ow by nearly $10 billion over
the past decade. We ended 2011 with $11.9 billion of
cash and marketable securities.
Investment and return to shareholders: Our cash ow
has enabled us to invest in the business and to generate
substantial returns to investors, while spending
$6.3 billion on R&D. In 2011 we invested $1.8 billion for
ve acquisitions in key areas of software and $4.1 billion
in net capital expenditures. We were able to return
$18.5 billion to you
—
$15 billion through share
repurchases and $3.5 billion through dividends. Last year’s
dividend increase was 15 percent, marking the 16th
year in a row in which we have raised our dividend, and
the 96th consecutive year in which we have paid one.
A road map to the future
This performance was the result of disciplined execution
by more than 400,000 IBMers and the strategic
repositioning of the company over the past decade.
We have steadily realigned our business to lead in a
new era of computing and to enable our clients to
benet from the new capabilities that era is creating.
As a consequence, our investors benet from a business
model that is both sustainable over the long term
and fueled by some of the world’s most attractive high-
growth markets and technologies.
A Letter from
the President and CEO