IBM 2011 Annual Report Download - page 50
Download and view the complete annual report
Please find page 50 of the 2011 IBM annual report below. You can navigate through the pages in the report by either clicking on the pages listed below, or by using the keyword search tool below to find specific information within the annual report.-
 1
1 -
2
-
3
-
4
-
5
-
6
-
7
-
8
-
9
-
10
-
11
-
12
-
13
-
14
-
15
-
16
-
17
-
18
-
19
-
20
-
21
-
22
-
23
-
24
-
25
-
26
-
27
-
28
-
29
-
30
-
31
-
32
-
33
-
34
-
35
-
36
-
37
-
38
-
39
-
 40
40 -
 41
41 -
 42
42 -
 43
43 -
 44
44 -
 45
45 -
 46
46 -
 47
47 -
 48
48 -
 49
49 -
 50
50 -
 51
51 -
 52
52 -
 53
53 -
 54
54 -
 55
55 -
 56
56 -
 57
57 -
 58
58 -
 59
59 -
 60
60 -
61
-
62
-
63
-
64
-
65
-
66
-
67
-
68
-
69
-
70
-
71
-
72
-
73
-
74
-
75
-
76
-
77
-
78
-
79
-
80
-
81
-
82
-
83
-
84
-
85
-
86
-
87
-
88
-
89
-
90
-
91
-
92
-
93
-
94
-
95
-
96
-
97
-
98
-
99
-
100
-
101
-
102
-
103
-
104
-
105
-
106
-
107
-
108
-
109
-
110
-
111
-
112
-
113
-
114
-
115
-
116
-
117
-
118
-
119
-
120
-
121
-
122
-
123
-
124
-
125
-
126
-
127
-
128
-
129
-
130
-
131
-
132
-
133
-
134
-
135
-
136
-
137
-
138
-
139
-
140
-
141
-
142
-
143
-
144
-
145
-
146
-
147
-
148
 |
 |

48
Management Discussion
International Business Machines Corporation and Subsidiary Companies
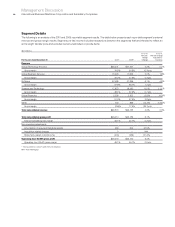
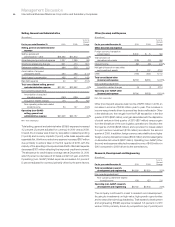
GTS gross profit margin declined 0.3 points to 34.5 percent in 2010.
Segment pre-tax profit increased to $5,499 million with a pre-tax
margin of 13.9 percent. On a normalized basis, segment pre-tax
income in 2010 increased 4.6 percent and margin expanded 0.4 points
to 14.6 percent reflecting the benefits from workforce rebalancing
and an improved revenue growth trend.
GBS gross profit increased 4.2 percent in 2010, in line with
revenue growth. Gross profit margin of 28.0 percent increased
0.3 points year to year. Segment pre-tax profit improved 1.8 percent
to $2,546 million with a pre-tax margin decline of 0.1 points year over
year. On a normalized basis, segment pre-tax income in 2010 increased
3.7 percent with a pre-tax margin of 14.1 percent, an increase of
0.2 points compared to 2009. Throughout 2010, GBS improved
utilization and delivery excellence, while continuing to invest in globally
integrated capabilities and skills to support growth initiatives.
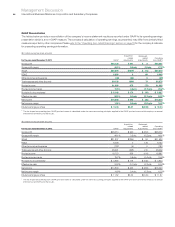
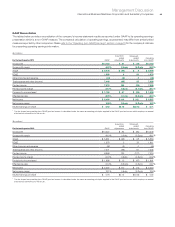
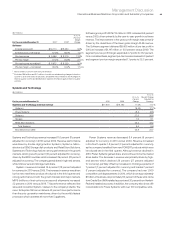
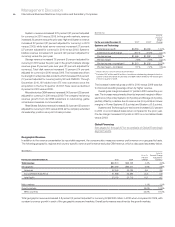
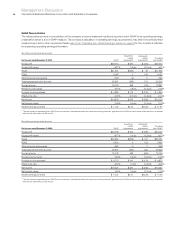
Software
($ in millions)
For the year ended December 31: 2010 2009
Yr.-to-Yr.
Percent
Change
Yr.-to-Yr.
Percent Change
Adjusted for
Currency
Software external revenue $22,485 $21,396 5.1% 4.8%
Middleware $18,444 $17,125 7.7% 7.5%
Key Branded Middleware 13,876 12,524 10.8 10.7
WebSphere 20.8 20.6
Information Management 8.6 8.3
Lotus (2.3) (2.1)
Tivoli 15.0 15.1
Rational 4.8 4.8
Other middleware 4,568 4,602 (0.7) (1.2)
Operating systems 2,282 2,163 5.5 4.9
Other 1,759 2,108 (16.6) (17.0)
Software revenue of $22,485 million increased 5.1 percent
(5 percent adjusted for currency) in 2010 compared to 2009. Adjusting
for the divested PLM operations, revenue grew at 8.1 percent (8 percent
adjusted for currency) in 2010. Software revenue growth continued
to be led by the key branded middleware products with strong
performance in the areas of business commerce, business analytics,
storage management and business integration. Overall, the Software
business performed well in 2010, delivering over $9 billion in segment
pre-tax profit, an increase of 12 percent as reported versus 2009.
In addition, the company continued to invest in additional capabilities
for the software business through both organic investments and the
completion of 13 acquisitions in 2010.
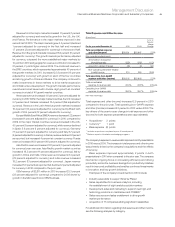
Key branded middleware revenue increased 10.8 percent
(11 percent adjusted for currency) and gained market share again in
2010 as the Software business extended its lead in the middleware
market. Software revenue continued to mix to the faster growing
branded middleware which accounted for 62 percent of total software
revenue in 2010, an increase of 3 points from 2009. Adjusted for
currency, growth in 2010 was led by growth in WebSphere and Tivoli.
The Software business continued to benefit from the company’s
growth initiatives, with business analytics revenue up year over year.
WebSphere revenue increased 20.8 percent (21 percent adjusted
for currency) in 2010 with strong performance throughout the year.
Application Servers software had revenue growth of 12.0 percent
(12 percent adjusted for currency) year to year. Business Integration
software, which includes the ILOG, Sterling Commerce and Lombardi
acquisitions, delivered strong revenue growth in 2010, up 33.6 percent
(33 percent adjusted for currency).
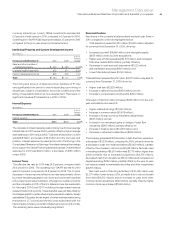
Information Management revenue increased 8.6 percent
(8 percent adjusted for currency) in 2010 versus the prior year
with revenue growth in both Information Management solutions
and infrastructure offerings. The software business continued to
expand its Information Management capabilities through strategic
acquisitions, as the company completed the acquisitions of Netezza,
OpenPages, PSS Systems, Clarity Systems and Initiate Systems.
Tivoli revenue increased 15.0 percent (15 percent adjusted for
currency) in 2010 when compared to 2009, with revenue growth in
each element of the Integrated Service management strategy—
Systems management, Security and Storage management. Tivoli
provides clients an integrated approach to service management.
Rational revenue increased 4.8 percent (5 percent adjusted for
currency) in 2010 versus 2009.
Operating systems revenue increased 5.5 percent (5 percent
adjusted for currency) in 2010 compared to 2009, driven by Power
Systems and System x related products.
Other software revenue decreased 16.6 percent (17 percent
adjusted for currency) due primarily to the divestiture of the PLM
operations in the first quarter of 2010.