IBM 2011 Annual Report Download - page 108
Download and view the complete annual report
Please find page 108 of the 2011 IBM annual report below. You can navigate through the pages in the report by either clicking on the pages listed below, or by using the keyword search tool below to find specific information within the annual report.-
 1
1 -
2
-
3
-
4
-
5
-
6
-
7
-
8
-
9
-
10
-
11
-
12
-
13
-
14
-
15
-
16
-
17
-
18
-
19
-
20
-
21
-
22
-
23
-
24
-
25
-
26
-
27
-
28
-
29
-
30
-
31
-
32
-
33
-
34
-
35
-
36
-
37
-
38
-
39
-
40
-
41
-
42
-
43
-
44
-
45
-
46
-
47
-
48
-
49
-
50
-
51
-
52
-
53
-
54
-
55
-
56
-
57
-
58
-
59
-
60
-
61
-
62
-
63
-
64
-
65
-
66
-
67
-
68
-
69
-
70
-
71
-
72
-
73
-
74
-
75
-
76
-
77
-
78
-
79
-
80
-
81
-
82
-
83
-
84
-
85
-
86
-
87
-
88
-
89
-
90
-
91
-
92
-
93
-
94
-
95
-
96
-
97
-
 98
98 -
 99
99 -
 100
100 -
 101
101 -
 102
102 -
 103
103 -
 104
104 -
 105
105 -
 106
106 -
 107
107 -
 108
108 -
 109
109 -
 110
110 -
 111
111 -
 112
112 -
 113
113 -
 114
114 -
 115
115 -
 116
116 -
 117
117 -
 118
118 -
119
-
120
-
121
-
122
-
123
-
124
-
125
-
126
-
127
-
128
-
129
-
130
-
131
-
132
-
133
-
134
-
135
-
136
-
137
-
138
-
139
-
140
-
141
-
142
-
143
-
144
-
145
-
146
-
147
-
148
 |
 |

Notes to Consolidated Financial Statements
International Business Machines Corporation and Subsidiary Companies106
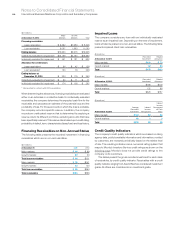
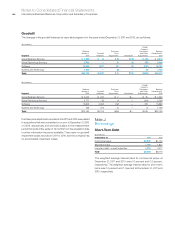
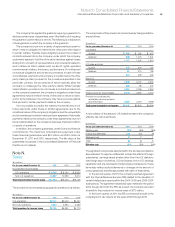
Goodwill
The changes in the goodwill balances by reportable segment, for the years ended December 31, 2011 and 2010, are as follows:
($ in millions)
Segment
Balance
January 1,
2011
Goodwill
Additions
Purchase
Price
Adjustments Divestitures
Foreign
Currency
Translation
and Other
Adjustments
Balance
December 31,
2011
Global Business Services $ 4,329 $ 14 $ (0) $(10) $ (20) $ 4,313
Global Technology Services 2,704 — (1) (2) (55) 2,646
Software 16,963 1,277 10 (2) (127) 18,121
Systems and Technology 1,139 — (6) — (0) 1,133
To t a l $25,136 $1,291 $ 2 $(13) $(203) $26,213
($ in millions)
Segment
Balance
January 1,
2010
Goodwill
Additions
Purchase
Price
Adjustments Divestitures
Foreign
Currency
Translation
and Other
Adjustments
Balance
December 31,
2010
Global Business Services $ 4,042 $ 252 $ 0 $— $ 35 $ 4,329
Global Technology Services 2,777 32 (1) — (104) 2,704
Software 12,605 4,095 (52) — 315 16,963
Systems and Technology 766 375 (1) — (1) 1,139
To t a l $20,190 $4,754 $(54) $— $ 245 $25,136
Purchase price adjustments recorded in the 2011 and 2010 were related
to acquisitions that were completed on or prior to December 31, 2010
or 2009, respectively, and were still subject to the measurement
period that ends at the earlier of 12 months from the acquisition date
or when information becomes available. There were no goodwill
impairment losses recorded in 2011 or 2010, and the company has
no accumulated impairment losses.
Note J.
Borrowings
Short-Term Debt
($ in millions)
At December 31: 2011 2010
Commercial paper $2,300 $1,144
Short-term loans 1,859 1,617
Long-term debt—current maturities 4,306 4,017
To t a l $8,463 $6,778
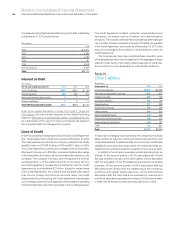
The weighted-average interest rates for commercial paper at
December 31, 2011 and 2010 were 0.1 percent and 0.2 percent,
respectively. The weighted-average interest rates for short-term
loans was 1.2 percent and 1.1 percent at December 31, 2011 and
2010, respectively.