IBM 2011 Annual Report Download - page 107
Download and view the complete annual report
Please find page 107 of the 2011 IBM annual report below. You can navigate through the pages in the report by either clicking on the pages listed below, or by using the keyword search tool below to find specific information within the annual report.-
 1
1 -
2
-
3
-
4
-
5
-
6
-
7
-
8
-
9
-
10
-
11
-
12
-
13
-
14
-
15
-
16
-
17
-
18
-
19
-
20
-
21
-
22
-
23
-
24
-
25
-
26
-
27
-
28
-
29
-
30
-
31
-
32
-
33
-
34
-
35
-
36
-
37
-
38
-
39
-
40
-
41
-
42
-
43
-
44
-
45
-
46
-
47
-
48
-
49
-
50
-
51
-
52
-
53
-
54
-
55
-
56
-
57
-
58
-
59
-
60
-
61
-
62
-
63
-
64
-
65
-
66
-
67
-
68
-
69
-
70
-
71
-
72
-
73
-
74
-
75
-
76
-
77
-
78
-
79
-
80
-
81
-
82
-
83
-
84
-
85
-
86
-
87
-
88
-
89
-
90
-
91
-
92
-
93
-
94
-
95
-
96
-
 97
97 -
 98
98 -
 99
99 -
 100
100 -
 101
101 -
 102
102 -
 103
103 -
 104
104 -
 105
105 -
 106
106 -
 107
107 -
 108
108 -
 109
109 -
 110
110 -
 111
111 -
 112
112 -
 113
113 -
 114
114 -
 115
115 -
 116
116 -
 117
117 -
118
-
119
-
120
-
121
-
122
-
123
-
124
-
125
-
126
-
127
-
128
-
129
-
130
-
131
-
132
-
133
-
134
-
135
-
136
-
137
-
138
-
139
-
140
-
141
-
142
-
143
-
144
-
145
-
146
-
147
-
148
 |
 |
Notes to Consolidated Financial Statements
International Business Machines Corporation and Subsidiary Companies 105
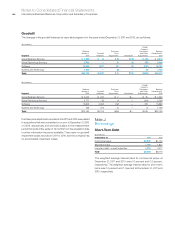
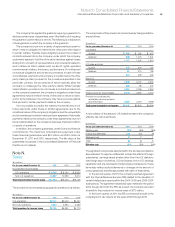
Note I.
Intangible Assets Including Goodwill
Intangible Assets
The following table details the company’s intangible asset balances
by major asset class.
($ in millions)
At December 31, 2011:
Gross
Carrying
Amount
Accumulated
Amortization
Net
Carrying
Amount
Intangible asset class
Capitalized software $1,478 $ (678) $ 799
Client relationships 1,751 (715) 1,035
Completed technology 2,156 (745) 1,411
In-process R&D 22 (1) 21
Patents/trademarks 207 (88) 119
Other* 29 (22) 7
To t a l $5,642 $(2,250) $3,392
($ in millions)
At December 31, 2010:
Gross
Carrying
Amount
Accumulated
Amortization
Net
Carrying
Amount
Intangible asset class
Capitalized software $1,558 $ (726) $ 831
Client relationships 1,709 (647) 1,062
Completed technology 2,111 (688) 1,422
In-process R&D 21 (0) 21
Patents/trademarks 211 (71) 140
Other* 39 (28) 11
To t a l $5,649 $(2,161) $3,488
*
Other intangibles are primarily acquired proprietary and nonproprietary business
processes, methodologies and systems.
The net carrying amount of intangible assets decreased $96 million
during the year ended December 31, 2011, primarily due to amortization,
partially offset by intangible asset additions. No impairment of
intangible assets was recorded in any of the periods presented.
Total amortization was $1,226 million and $1,174 million for the
years ended December 31, 2011 and 2010, respectively. The aggregate
intangible amortization expense for acquired intangibles (excluding
capitalized software) was $634 million and $517 million for the years
ended December 31, 2011 and 2010, respectively. In addition, in 2011
the company retired $1,133 million of fully amortized intangible assets,
impacting both the gross carrying amount and accumulated
amortization for this amount.
The amortization expense for each of the five succeeding years
relating to intangible assets currently recorded in the Consolidated
Statement of Financial Position is estimated to be the following at
December 31, 2011:
($ in millions)
Capitalized
Software
Acquired
Intangibles Tot a l
2012 $480 $634 $1,113
2013 250 590 840
2014 70 446 516
2015 — 340 340
2016 — 303 303