IBM 2011 Annual Report Download - page 129
Download and view the complete annual report
Please find page 129 of the 2011 IBM annual report below. You can navigate through the pages in the report by either clicking on the pages listed below, or by using the keyword search tool below to find specific information within the annual report.-
 1
1 -
2
-
3
-
4
-
5
-
6
-
7
-
8
-
9
-
10
-
11
-
12
-
13
-
14
-
15
-
16
-
17
-
18
-
19
-
20
-
21
-
22
-
23
-
24
-
25
-
26
-
27
-
28
-
29
-
30
-
31
-
32
-
33
-
34
-
35
-
36
-
37
-
38
-
39
-
40
-
41
-
42
-
43
-
44
-
45
-
46
-
47
-
48
-
49
-
50
-
51
-
52
-
53
-
54
-
55
-
56
-
57
-
58
-
59
-
60
-
61
-
62
-
63
-
64
-
65
-
66
-
67
-
68
-
69
-
70
-
71
-
72
-
73
-
74
-
75
-
76
-
77
-
78
-
79
-
80
-
81
-
82
-
83
-
84
-
85
-
86
-
87
-
88
-
89
-
90
-
91
-
92
-
93
-
94
-
95
-
96
-
97
-
98
-
99
-
100
-
101
-
102
-
103
-
104
-
105
-
106
-
107
-
108
-
109
-
110
-
111
-
112
-
113
-
114
-
115
-
116
-
117
-
118
-
 119
119 -
 120
120 -
 121
121 -
 122
122 -
 123
123 -
 124
124 -
 125
125 -
 126
126 -
 127
127 -
 128
128 -
 129
129 -
 130
130 -
 131
131 -
 132
132 -
 133
133 -
 134
134 -
 135
135 -
 136
136 -
 137
137 -
 138
138 -
 139
139 -
140
-
141
-
142
-
143
-
144
-
145
-
146
-
147
-
148
 |
 |

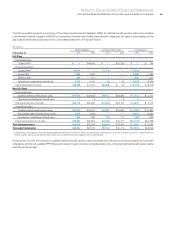
Notes to Consolidated Financial Statements
International Business Machines Corporation and Subsidiary Companies 127
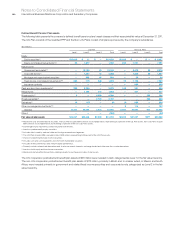
The table below presents the assumptions used to measure the net periodic (income)/cost and the year-end benefit obligations for retirement-
related benefit plans.
Defined Benefit Pension Plans
U.S. Plans Non-U.S. Plans
2011 2010 2009 2011 2010 2009
Weighted-average assumptions used to measure net
periodic (income)/cost for the year ended December 31:
Discount rate 5.00% 5.60% 5.75% 4.33% 4.84% 4.89%
Expected long-term returns
on plan assets 8.00% 8.00% 8.00% 6.41% 6.56% 6.73%
Rate of compensation increase* N/A N/A N/A 2.37% 2.92% 3.09%
Weighted-average assumptions used to measure
benefit obligations at December 31:
Discount rate 4.20% 5.00% 5.60% 4.28% 4.33% 4.84%
Rate of compensation increase* N/A N/A N/A 2.43% 2.37% 2.92%
* Rate of compensation increase is not applicable to the U.S. defined benefit pension plans as benefit accruals ceased December 31, 2007 for all participants.
N/A—Not applicable
Nonpension Postretirement Benefit Plans
U.S. Plan Non-U.S. Plans
2011 2010 2009 2011 2010 2009
Weighted-average assumptions used to measure net
periodic cost for the year ended December 31:
Discount rate 4.80% 5.40% 5.75% 7.75% 7.92% 7.36%
Expected long-term returns
on plan assets N/A N/A N/A 9.07% 9.16% 9.19%
Weighted-average assumptions used to measure
benefit obligations at December 31:
Discount rate 3.90% 4.80% 5.40% 7.37% 7.75% 7.92%
N/A—Not applicable
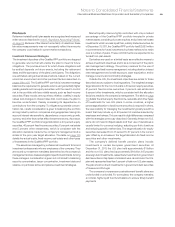
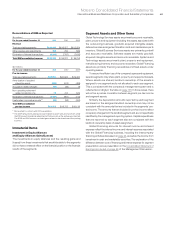
Discount Rate
The discount rate assumptions used for retirement-related benefit
plans accounting reflect the yields available on high-quality, fixed
income debt instruments at the measurement date. For the U.S. and
certain non-U.S. countries, a portfolio of high-quality corporate bonds
is used to construct a yield curve. The cash flows from the company’s
expected benefit obligation payments are then matched to the yield
curve to derive the discount rates. In other non-U.S. countries, where
the markets for high-quality long-term bonds are not generally as
well developed, a portfolio of long-term government bonds is used
as a base, to which a credit spread is added to simulate corporate
bond yields at these maturities in the jurisdiction of each plan, as
the benchmark for developing the respective discount rates.
For the U.S. defined benefit pension plans, the changes in the
discount rate assumptions impacted the net periodic (income)/cost
and the PBO. The changes in the discount rate assumptions resulted
in a decrease in 2011 net periodic income of $171 million, a decrease
in 2010 net periodic income of $40 million and a decrease in 2009
net periodic income of $70 million. The changes in the discount rate
assumptions resulted in an increase in the PBO of $4,216 million and
$2,943 million at December 31, 2011 and 2010, respectively.
For the nonpension postretirement benefit plans, the changes in
the discount rate assumptions had no material impact on net periodic
cost for the years ended December 31, 2011, 2010 and 2009 and
resulted in an increase in the APBO of $359 million and $240 million
at December 31, 2011 and 2010, respectively.