IBM 2011 Annual Report Download - page 14
Download and view the complete annual report
Please find page 14 of the 2011 IBM annual report below. You can navigate through the pages in the report by either clicking on the pages listed below, or by using the keyword search tool below to find specific information within the annual report.-
 1
1 -
2
-
3
-
 4
4 -
 5
5 -
 6
6 -
 7
7 -
 8
8 -
 9
9 -
 10
10 -
 11
11 -
 12
12 -
 13
13 -
 14
14 -
 15
15 -
 16
16 -
 17
17 -
 18
18 -
 19
19 -
 20
20 -
 21
21 -
 22
22 -
 23
23 -
 24
24 -
25
-
26
-
27
-
28
-
29
-
30
-
31
-
32
-
33
-
34
-
35
-
36
-
37
-
38
-
39
-
40
-
41
-
42
-
43
-
44
-
45
-
46
-
47
-
48
-
49
-
50
-
51
-
52
-
53
-
54
-
55
-
56
-
57
-
58
-
59
-
60
-
61
-
62
-
63
-
64
-
65
-
66
-
67
-
68
-
69
-
70
-
71
-
72
-
73
-
74
-
75
-
76
-
77
-
78
-
79
-
80
-
81
-
82
-
83
-
84
-
85
-
86
-
87
-
88
-
89
-
90
-
91
-
92
-
93
-
94
-
95
-
96
-
97
-
98
-
99
-
100
-
101
-
102
-
103
-
104
-
105
-
106
-
107
-
108
-
109
-
110
-
111
-
112
-
113
-
114
-
115
-
116
-
117
-
118
-
119
-
120
-
121
-
122
-
123
-
124
-
125
-
126
-
127
-
128
-
129
-
130
-
131
-
132
-
133
-
134
-
135
-
136
-
137
-
138
-
139
-
140
-
141
-
142
-
143
-
144
-
145
-
146
-
147
-
148
 |
 |

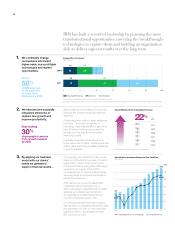
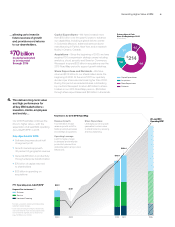
5. … while driving a new era
of growth and leadership
for IBM…
2015 Road Map Objective:
Growth initiatives
will contribute about
$20 billion
in incremental
revenue growth
Growth Markets
The world’s emerging markets will drive more than 60 percent of global GDP growth in
the next four years. IBM is investing in more than 100 of these countries, which are building
out critical infrastructure, developing strategic industries and responding to massive
demographic shifts, such as rapid urbanization.
Our four complementary growth initiatives—business analytics, cloud, growth markets
and Smarter Planet—target opportunities that are changing the global IT landscape. With
strong contribution from these initiatives, IBM delivered 7 percent revenue growth in 2011.
In 2011 we opened nearly 100 new branch
offices to expand our presence beyond
large cities and beyond the BRICs (Brazil,
Russia, India and China), and to participate
in high-growth industries.
We are creating hubs of expertise around the
world. These include the Institute for Electronic
Government and the Energy and Utilities
Solution Lab in China; Natural Resource
Solution Centers in Perth and Rio de Janeiro;
Banking Centers in Singapore and São Paulo;
and a Latin American micro-financing center
in Lima.
In Africa, IBM is investing to bring expertise
in areas like financial services. For example,
we are working with five leading Kenyan
banks on infrastructure projects and helping
Safaricom, through a partnership with
Vodafone, provide its M-PESA mobile money
service to more than 15 million customers.
$1.9 billion
Growth Markets
$2.2 billion
Major Markets
Geographic Gross Profit Growth
In 2011, growth markets
generated nearly half
of IBM’s geographic gross
profit growth.
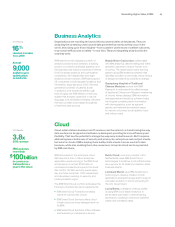
2011 Performance
Growth Markets
22% of IBM’s
geographic revenue
Business Analytics
16% revenue increase
from 2010
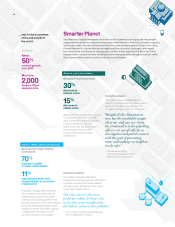
Smarter Planet
Nearly 50% revenue
increase from 2010
Cloud
3.8 times 2010 revenue
2011 Results:
22%
of IBM’s geographic
revenue
11%
revenue increase
at constant currency
from 2010
Nearly
40
countries grew
double digits at
constant currency
Nearly
60%
of growth markets
revenue is now outside
the BRICs
12