IBM 2011 Annual Report Download - page 138
Download and view the complete annual report
Please find page 138 of the 2011 IBM annual report below. You can navigate through the pages in the report by either clicking on the pages listed below, or by using the keyword search tool below to find specific information within the annual report.-
 1
1 -
2
-
3
-
4
-
5
-
6
-
7
-
8
-
9
-
10
-
11
-
12
-
13
-
14
-
15
-
16
-
17
-
18
-
19
-
20
-
21
-
22
-
23
-
24
-
25
-
26
-
27
-
28
-
29
-
30
-
31
-
32
-
33
-
34
-
35
-
36
-
37
-
38
-
39
-
40
-
41
-
42
-
43
-
44
-
45
-
46
-
47
-
48
-
49
-
50
-
51
-
52
-
53
-
54
-
55
-
56
-
57
-
58
-
59
-
60
-
61
-
62
-
63
-
64
-
65
-
66
-
67
-
68
-
69
-
70
-
71
-
72
-
73
-
74
-
75
-
76
-
77
-
78
-
79
-
80
-
81
-
82
-
83
-
84
-
85
-
86
-
87
-
88
-
89
-
90
-
91
-
92
-
93
-
94
-
95
-
96
-
97
-
98
-
99
-
100
-
101
-
102
-
103
-
104
-
105
-
106
-
107
-
108
-
109
-
110
-
111
-
112
-
113
-
114
-
115
-
116
-
117
-
118
-
119
-
120
-
121
-
122
-
123
-
124
-
125
-
126
-
127
-
 128
128 -
 129
129 -
 130
130 -
 131
131 -
 132
132 -
 133
133 -
 134
134 -
 135
135 -
 136
136 -
 137
137 -
 138
138 -
 139
139 -
 140
140 -
 141
141 -
 142
142 -
 143
143 -
 144
144 -
 145
145 -
 146
146 -
 147
147 -
 148
148
 |
 |

Notes to Consolidated Financial Statements
International Business Machines Corporation and Subsidiary Companies136
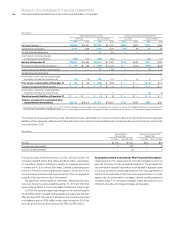
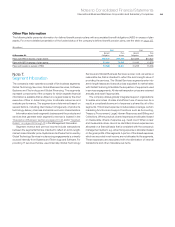
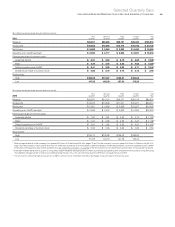
The following tables reflect the results of operations of the company’s segments consistent with the management and measurement system
utilized within the company. Performance measurement is based on pre-tax income. These results are used, in part, by senior management,
both in evaluating the performance of, and in allocating resources to, each of the segments. Effective January 1, 2011, the company transitioned
its management and measurement system to reflect operating earnings in an effort to provide better transparency into the operating results
of the business. As a result, certain acquisition-related charges and non-operating retirement-related costs are not reflected in the segment
results. See the “Operating (non-GAAP) Earnings” section on page 18 for additional information regarding this change. Prior year segment
pre-tax income and pre-tax margin have been reclassified to conform to the new management and measurement system.
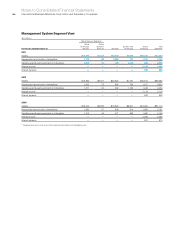
Management System Segment View
($ in millions)
Global Services Segments
For the year ended December 31:
Global
Technology
Services
Global
Business
Services Software
Systems and
Technology
Global
Financing
Tot a l
Segments
2011
External revenue $40,879 $19,284 $24,944 $ 18,985 $2,102 $106,194
Internal revenue 1,242 797 3,276 838 2,092 8,246
Total revenue $42,121 $20,081 $28,219 $19,823 $4,195 $114,440
Pre-tax income $ 6,284 $ 3,006 $ 9,970 $ 1,633 $2,011 $ 22,904
Revenue year-to-year change 6.6% 5.6% 10.9% 5.6% 2.8% 7.1%
Pre-tax income year-to-year change 14.3% 18.1% 5.3% 12.2% 2.8% 9.5%
Pre-tax income margin 14.9% 15.0% 35.3% 8.2% 47.9% 20.0%
2010
External revenue $38,201 $18,223 $22,485 $ 17,973 $2,238 $ 99,120
Internal revenue 1,313 798 2,950 804 1,842 7,707
Total revenue $39,514 $19,021 $25,436 $18,777 $4,080 $106,827
Pre-tax income* $ 5,499 $ 2,546 $ 9,466 $ 1,456 $1,956 $ 20,923
Revenue year-to-year change 2.0% 2.6% 5.7% 9.8% 0.1% 4.2%
Pre-tax income year-to-year change* 0.3% 1.8% 13.8% 12.1% 13.5% 8.3%
Pre-tax income margin* 13.9% 13.4% 37.2% 7.8% 48.0% 19.6%
2009
External revenue $37,347 $17,653 $21,396 $ 16,190 $2,302 $ 94,889
Internal revenue 1,386 887 2,677 911 1,774 7,635
Total revenue $38,734 $18,540 $24,073 $17,102 $4,076 $102,524
Pre-tax income* $ 5,482 $ 2,501 $ 8,319 $ 1,298 $1,724 $ 19,323
Revenue year-to-year change (5.1)% (10.3)% (3.1)% (15.2)% (8.4)% (7.6)%
Pre-tax income year-to-year change* 23.0% (3.4)% 13.9% (8.8)% 7.1% 11.2%
Pre-tax income margin* 14.2% 13.5% 34.6% 7.6% 42.3% 18.8%
* Reclassified to conform with 2011 presentation.