IBM 2011 Annual Report Download - page 30
Download and view the complete annual report
Please find page 30 of the 2011 IBM annual report below. You can navigate through the pages in the report by either clicking on the pages listed below, or by using the keyword search tool below to find specific information within the annual report.-
 1
1 -
2
-
3
-
4
-
5
-
6
-
7
-
8
-
9
-
10
-
11
-
12
-
13
-
14
-
15
-
16
-
17
-
18
-
19
-
 20
20 -
 21
21 -
 22
22 -
 23
23 -
 24
24 -
 25
25 -
 26
26 -
 27
27 -
 28
28 -
 29
29 -
 30
30 -
 31
31 -
 32
32 -
 33
33 -
 34
34 -
 35
35 -
 36
36 -
 37
37 -
 38
38 -
 39
39 -
 40
40 -
41
-
42
-
43
-
44
-
45
-
46
-
47
-
48
-
49
-
50
-
51
-
52
-
53
-
54
-
55
-
56
-
57
-
58
-
59
-
60
-
61
-
62
-
63
-
64
-
65
-
66
-
67
-
68
-
69
-
70
-
71
-
72
-
73
-
74
-
75
-
76
-
77
-
78
-
79
-
80
-
81
-
82
-
83
-
84
-
85
-
86
-
87
-
88
-
89
-
90
-
91
-
92
-
93
-
94
-
95
-
96
-
97
-
98
-
99
-
100
-
101
-
102
-
103
-
104
-
105
-
106
-
107
-
108
-
109
-
110
-
111
-
112
-
113
-
114
-
115
-
116
-
117
-
118
-
119
-
120
-
121
-
122
-
123
-
124
-
125
-
126
-
127
-
128
-
129
-
130
-
131
-
132
-
133
-
134
-
135
-
136
-
137
-
138
-
139
-
140
-
141
-
142
-
143
-
144
-
145
-
146
-
147
-
148
 |
 |

28
Management Discussion
International Business Machines Corporation and Subsidiary Companies
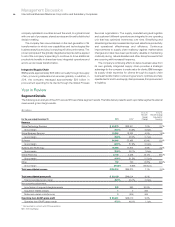
Global Technology Services revenue of $40,879 million increased
7.0 percent (3 percent adjusted for currency) in 2011 versus 2010.
Revenue performance was led by the growth markets which were
up 16.8 percent (11 percent adjusted for currency). GTS Outsourcing
revenue increased 7.5 percent (3 percent adjusted for currency) in
2011 and gained share. Outsourcing performance in 2011 was driven
by strength in the growth markets with revenue up 11 percent,
adjusted for currency, as the outsourcing offerings are continuing to
help clients build out their IT infrastructures. Integrated Technology
Services (ITS) revenue increased 8.5 percent (4 percent adjusted
for currency) in 2011 versus 2010, also led by the growth markets
which increased 13 percent, adjusted for currency. Revenue growth
year over year, adjusted for currency, in both GTS Outsourcing and
ITS was relatively consistent over the course of the year.
Global Business Services revenue of $19,284 million increased
5.8 percent (1 percent adjusted for currency) in 2011 led by strength
in the growth markets with revenue up 17.4 percent (11 percent
adjusted for currency). Application Outsourcing revenue increased
9.5 percent (5 percent adjusted for currency) in 2011 year to year.
Consulting and Systems Integration (C&SI), which includes Consulting,
Application Management Services systems integration and the U.S.
Federal business, grew revenue in 2011 4.8 percent (1 percent
adjusted for currency). Both GBS lines of business had strong year-
to-year performance in the growth markets with double-digit constant
currency revenue growth. GBS was impacted in 2011 by revenue
declines in Japan and in the Public Sector; excluding Japan and
the Public Sector, total GBS revenue increased 11.9 percent in 2011
(8 percent adjusted for currency).
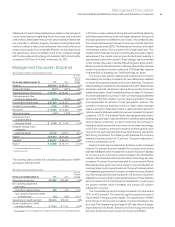
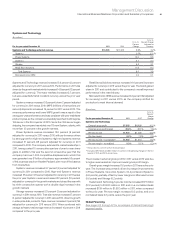
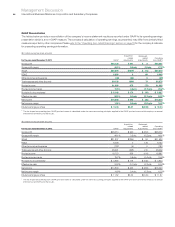
($ in millions)
For the year ended December 31: 2011 2010*
Yr.-to-Yr.
Percent/
Margin
Change
Global Services
Global Technology Services
External gross profit $14,320 $13,194 8.5%
External gross profit margin 35.0% 34.5% 0.5 pts.
Pre-tax income $ 6,284 $ 5,499 14.3%
Pre-tax margin 14.9% 13.9% 1.0 pts.
Pre-tax income—normalized** $ 6,399 $ 5,771 10.9%
Pre-tax margin—normalized 15.2% 14.6% 0.6 pts.
Global Business Services
External gross profit $ 5,545 $ 5,106 8.6%
External gross profit margin 28.8% 28.0% 0.7 pts.
Pre-tax income $ 3,006 $ 2,546 18.1%
Pre-tax margin 15.0% 13.4% 1.6 pts.
Pre-tax income—normalized+$ 3,052 $ 2,674 14.1%
Pre-tax margin—normalized 15.2% 14.1% 1.1 pts.
* Reclassified to conform with 2011 presentation.
** Excludes $116 million and $273 million of workforce rebalancing charges in the first
quarter of 2011 and 2010, respectively.
+
Excludes $45 million and $128 million of workforce rebalancing charges in the first
quarter of 2011 and 2010, respectively.
GTS gross profit increased 8.5 percent in 2011 and gross margin
improved 0.5 points year to year. Margin expansion was driven by
improved gross profit performance in all lines of business. Pre-tax
income increased to $6,284 million in 2011 with a pre-tax margin of
14.9 percent. On a normalized basis, segment pre-tax income in
2011 increased 10.9 percent and margin expanded 0.6 points to
15.2 percent.
GBS gross profit increased 8.6 percent in 2011 and gross margin
improved 0.7 points to 28.8 percent, led primarily by margin
improvement in Application Management Services Outsourcing.
GBS segment pre-tax income improved 18.1 percent to $3,006 million
with a pre-tax margin of 15.0 percent. On a normalized basis,
segment pre-tax income in 2011 increased 14.1 percent with a pre-tax
margin of 15.2 percent, an increase of 1.1 points year to year.
Total Global Services segment pre-tax income was $9,290 million
in 2011, an increase of $1,246 million or 15.5 percent year to year.
The combined pre-tax margin in 2011 improved 1.2 points versus
2010. On a normalized basis, total Global Services pre-tax income
in 2011 increased 11.9 percent with a pre-tax margin of 15.2 percent,
up 0.8 points year to year. In 2011, the company established two
Global Services integration hubs which will drive the business to a
new level of global consistency, integration and standardization in
the development and delivery of solutions to clients. Both Global
Services segments had strong profit and margin performance in
2011 as they continue to mix to higher value offerings and markets,
and continue to focus on productivity and cost management.
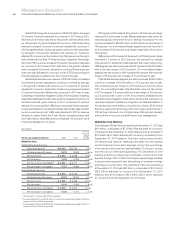
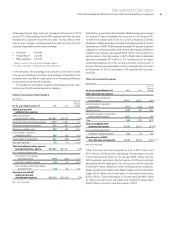
Global Services Backlog
The estimated Global Services backlog at December 31, 2011 was
$141 billion, a decrease of $1.7 billion (flat adjusted for currency)
compared to the December 31, 2010 balance, and an increase of
$3.8 billion ($4.7 billion adjusted for currency) compared to the
September 30, 2011 balance. There are three primary drivers
of total services revenue: backlog, new sales into the existing
contract base and new client signings. A very high percentage
of annual services revenue, approximately 70 percent, comes
from the run out of the opening backlog. The December 31, 2011
backlog position provides a very solid base of revenue for total
Services to begin 2012. In 2012, the company expects approximately
3 percent revenue growth from the backlog, at consistent foreign
exchange currency rates. The estimated outsourcing backlog
at December 31, 2011 was $93 billion, a decrease of $4.0 billion
($2.8 billion adjusted for currency) from December 31, 2010
balance, and an increase of $2.2 billion ($2.8 billion adjusted
for currency) from the September 30, 2011 level.