IBM 2011 Annual Report Download - page 96
Download and view the complete annual report
Please find page 96 of the 2011 IBM annual report below. You can navigate through the pages in the report by either clicking on the pages listed below, or by using the keyword search tool below to find specific information within the annual report.-
 1
1 -
2
-
3
-
4
-
5
-
6
-
7
-
8
-
9
-
10
-
11
-
12
-
13
-
14
-
15
-
16
-
17
-
18
-
19
-
20
-
21
-
22
-
23
-
24
-
25
-
26
-
27
-
28
-
29
-
30
-
31
-
32
-
33
-
34
-
35
-
36
-
37
-
38
-
39
-
40
-
41
-
42
-
43
-
44
-
45
-
46
-
47
-
48
-
49
-
50
-
51
-
52
-
53
-
54
-
55
-
56
-
57
-
58
-
59
-
60
-
61
-
62
-
63
-
64
-
65
-
66
-
67
-
68
-
69
-
70
-
71
-
72
-
73
-
74
-
75
-
76
-
77
-
78
-
79
-
80
-
81
-
82
-
83
-
84
-
85
-
 86
86 -
 87
87 -
 88
88 -
 89
89 -
 90
90 -
 91
91 -
 92
92 -
 93
93 -
 94
94 -
 95
95 -
 96
96 -
 97
97 -
 98
98 -
 99
99 -
 100
100 -
 101
101 -
 102
102 -
 103
103 -
 104
104 -
 105
105 -
 106
106 -
107
-
108
-
109
-
110
-
111
-
112
-
113
-
114
-
115
-
116
-
117
-
118
-
119
-
120
-
121
-
122
-
123
-
124
-
125
-
126
-
127
-
128
-
129
-
130
-
131
-
132
-
133
-
134
-
135
-
136
-
137
-
138
-
139
-
140
-
141
-
142
-
143
-
144
-
145
-
146
-
147
-
148
 |
 |

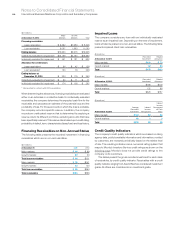
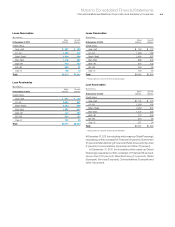
Notes to Consolidated Financial Statements
International Business Machines Corporation and Subsidiary Companies94
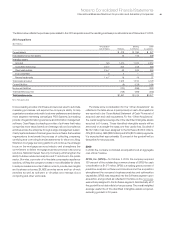
($ in millions)
At December 31, 2010: Level 1 Level 2 Level 3 To t a l
Assets
Cash equivalents (1)
Time deposits and certificates of deposit $ — $2,473 $— $ 2,473
Commercial paper — 2,673 — 2,673
Money market funds 1,532 — — 1,532
Canada government securities — 1,054 — 1,054
U.S. government securities — 44 — 44
U.S. government agency securities — 22 — 22
Other securities — 3 — 3
To ta l 1,532 6,269 — 7,801(6)
Debt securities—current (2)
Commercial paper — 490 — 490
U.S. government securities — 500 — 500
Other securities — 1 — 1
To ta l — 990 — 990
(6)
Debt securities—noncurrent (3) 1 6 — 7
Available-for-sale equity investments (3) 445 13 — 458
Derivative assets (4)
Interest rate contracts — 548 — 548
Foreign exchange contracts — 539 — 539
Equity contracts — 12 — 12
To ta l — 1,099 — 1,099 (7)
Total assets $1,978 $8,377 $— $10,355 (7)
Liabilities
Derivative liabilities (5)
Foreign exchange contracts $ — $1,003 $— $ 1,003
Equity contracts — 3 — 3
Total liabilities $ — $1,006 $— $ 1,006 (7)
(1) Included within cash and cash equivalents in the Consolidated Statement of Financial Position.
(2)
Reported as marketable securities in the Consolidated Statement of Financial Position.
(3) Included within investments and sundry assets in the Consolidated Statement of Financial Position.
(4)
The gross balances of derivative assets contained within prepaid expenses and other current assets, and investments and sundry assets in the Consolidated Statement
of Financial Position at December 31, 2010 are $511 million and $588 million, respectively.
(5)
The gross balances of derivative liabilities contained within other accrued expenses and liabilities, and other liabilities in the Consolidated Statement of Financial Position
at December 31, 2010 are $871 million and $135 million, respectively.
(6) Available-for-sale securities with carrying values that approximate fair value.
(7)
If derivative exposures covered by a qualifying master netting agreement had been netted in the Consolidated Statement of Financial Position, the total derivative asset and
liability positions would have been reduced by $475 million each.
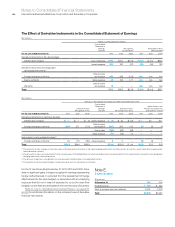
There were no significant transfers between Levels 1 and 2 for the years ended December 31, 2011 and 2010.