IBM 2011 Annual Report Download - page 12
Download and view the complete annual report
Please find page 12 of the 2011 IBM annual report below. You can navigate through the pages in the report by either clicking on the pages listed below, or by using the keyword search tool below to find specific information within the annual report.-
 1
1 -
 2
2 -
 3
3 -
 4
4 -
 5
5 -
 6
6 -
 7
7 -
 8
8 -
 9
9 -
 10
10 -
 11
11 -
 12
12 -
 13
13 -
 14
14 -
 15
15 -
 16
16 -
 17
17 -
 18
18 -
 19
19 -
 20
20 -
 21
21 -
 22
22 -
23
-
24
-
25
-
26
-
27
-
28
-
29
-
30
-
31
-
32
-
33
-
34
-
35
-
36
-
37
-
38
-
39
-
40
-
41
-
42
-
43
-
44
-
45
-
46
-
47
-
48
-
49
-
50
-
51
-
52
-
53
-
54
-
55
-
56
-
57
-
58
-
59
-
60
-
61
-
62
-
63
-
64
-
65
-
66
-
67
-
68
-
69
-
70
-
71
-
72
-
73
-
74
-
75
-
76
-
77
-
78
-
79
-
80
-
81
-
82
-
83
-
84
-
85
-
86
-
87
-
88
-
89
-
90
-
91
-
92
-
93
-
94
-
95
-
96
-
97
-
98
-
99
-
100
-
101
-
102
-
103
-
104
-
105
-
106
-
107
-
108
-
109
-
110
-
111
-
112
-
113
-
114
-
115
-
116
-
117
-
118
-
119
-
120
-
121
-
122
-
123
-
124
-
125
-
126
-
127
-
128
-
129
-
130
-
131
-
132
-
133
-
134
-
135
-
136
-
137
-
138
-
139
-
140
-
141
-
142
-
143
-
144
-
145
-
146
-
147
-
148
 |
 |
16.6
20.2%
6.7
10.1%
00 11
3
6
$18
12
15
9
0
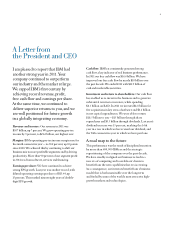
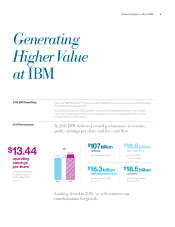
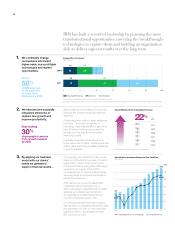
IBM has built a record of leadership by pursuing the most
transformational opportunities, inventing the breakthrough
technologies to capture them and building an organization
able to deliver superior results over the long term.
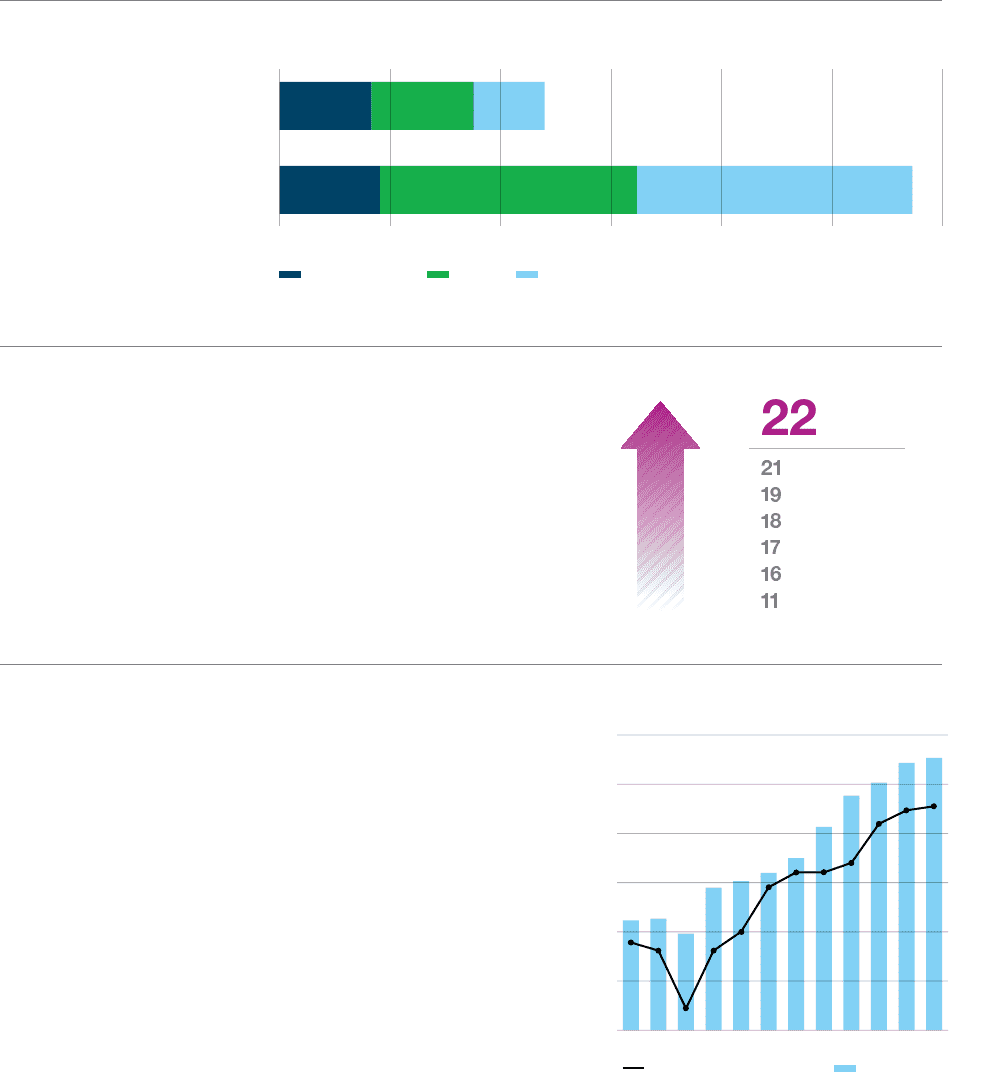
We continually change
our business mix toward
higher-value, more profitable
technologies and market
opportunities.
About
50%
of IBM segment
profit expected
to come from
Software by 2015
We have become a globally
integrated enterprise, to
capture new growth and
improve productivity.
Approaching
30%
of geographic revenue
from growth markets
by 2015
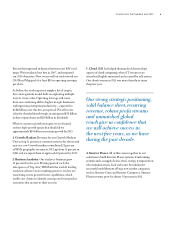
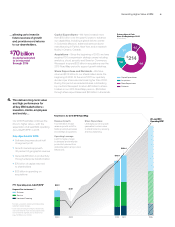
By aligning our business
model with our clients’
needs we generated
superior financial results …
Hardware/Financing Services Software
Segment Pre-Tax Income*
($ in billions)
IBM operations in more than 170 countries
leverage the company’s global scale and
expertise.
Global integration of all our major enterprise
functions—from service delivery to
marketing—has enabled IBM to gain more
than $6 billion in enterprise productivity
savings over the past five years while
improving quality.
A globally integrated model allows us to
focus resources on client-oriented work and
enable rapid deployment of IBM capabilities
to growth markets.
1.
2.
3.
0$2416 201284
3.6 9.3 10.0
3.3 3.7 2.6
2000**
2011
35%38%27%
16%41%44%
Operating Pre-tax Income Margin and Free Cash Flow
($ in billions)
* Sum of external segment pre-tax income not equal to IBM pre-tax income.
** Excludes Enterprise Investments and not restated for stock-based compensation. 2000 Segment PTI is reclassified to conform with 2011 presentation.
Growth Markets Share of Geographic Revenue
* Excluding divested businesses of PCs and printers.
Operating Pre-tax Income Margin Free Cash Flow
2011
2010
2009
2008
2007
2006
2000
%
%
%
%
%
%
%*
Our operating (non-GAAP) pre-tax income
margin in 2011 was 20.2 percent, 10 points
higher than in 2000. The primary driver
of this performance was gross profit margin
expansion, as a result of the shift in
our business mix to more profitable, higher-
value segments and improved productivity
across the enterprise.
At the same time, we’ve increased R&D
investment. Since the beginning of
2000, we’ve spent nearly $70 billion in R&D,
enabling us to deliver key innovations
and maintain U.S. patent leadership for
our 19th consecutive year in 2011.
Our strong business model performance
has resulted in consistently strong free cash
flow generation. In 2011 our free cash flow
was $16.6 billion—an increase of nearly
$10 billion since 2000.
10