IBM 2011 Annual Report Download - page 5
Download and view the complete annual report
Please find page 5 of the 2011 IBM annual report below. You can navigate through the pages in the report by either clicking on the pages listed below, or by using the keyword search tool below to find specific information within the annual report.-
 1
1 -
 2
2 -
 3
3 -
 4
4 -
 5
5 -
 6
6 -
 7
7 -
 8
8 -
 9
9 -
 10
10 -
 11
11 -
 12
12 -
 13
13 -
 14
14 -
 15
15 -
 16
16 -
17
-
18
-
19
-
20
-
21
-
22
-
23
-
24
-
25
-
26
-
27
-
28
-
29
-
30
-
31
-
32
-
33
-
34
-
35
-
36
-
37
-
38
-
39
-
40
-
41
-
42
-
43
-
44
-
45
-
46
-
47
-
48
-
49
-
50
-
51
-
52
-
53
-
54
-
55
-
56
-
57
-
58
-
59
-
60
-
61
-
62
-
63
-
64
-
65
-
66
-
67
-
68
-
69
-
70
-
71
-
72
-
73
-
74
-
75
-
76
-
77
-
78
-
79
-
80
-
81
-
82
-
83
-
84
-
85
-
86
-
87
-
88
-
89
-
90
-
91
-
92
-
93
-
94
-
95
-
96
-
97
-
98
-
99
-
100
-
101
-
102
-
103
-
104
-
105
-
106
-
107
-
108
-
109
-
110
-
111
-
112
-
113
-
114
-
115
-
116
-
117
-
118
-
119
-
120
-
121
-
122
-
123
-
124
-
125
-
126
-
127
-
128
-
129
-
130
-
131
-
132
-
133
-
134
-
135
-
136
-
137
-
138
-
139
-
140
-
141
-
142
-
143
-
144
-
145
-
146
-
147
-
148
 |
 |

3A Letter from the President and CEO
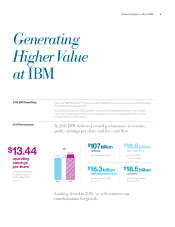
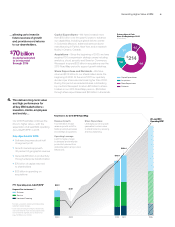
You see this expressed in nancial terms in our EPS road
maps. We introduced our rst in 2007, and surpassed
our 2010 objectives. Now, we are well on track toward our
2015 Road Map goal of at least $20 in operating earnings
per share.
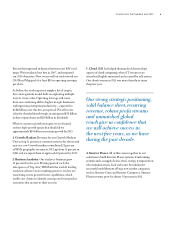
As before, the road map is not simply a list of targets,
but a management model built on exploiting multiple
ways to create value. Operating leverage will come
from our continuing shift to higher-margin businesses
and improving enterprise productivity
—
expected to
be $8 billion over this ve-year period. We will create
value for shareholders through an anticipated $50 billion
in share repurchases and $20 billion in dividends.
When it comes to growth strategies, we are focused
on four high-growth spaces that should drive
approximately $20 billion in revenue growth by 2015:
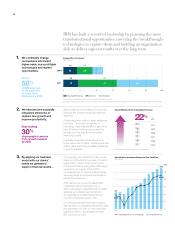
1. Growth Markets. Revenue for our Growth Markets
Unit was up 11 percent at constant currency for the second
year in a row. Growth markets contributed 22 percent
of IBM’s geographic revenue in 2011, up from 11 percent in
2000, and we expect them to approach 30 percent by 2015.
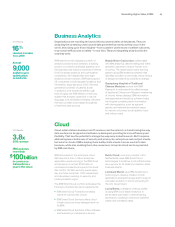
2. Business Analytics. Our analytics business grew
16 percent for the year. Having spotted early the
emergence of “big data,” IBM built the world’s leading
analytics software and consulting practice, and we are
translating it into powerful new capabilities, which
enable our clients to identify, manage and even predict
outcomes that matter to their success.
3. Cloud. IBM has helped thousands of clients adopt
aspects of cloud computing, where IT resources are
virtualized, highly automated and accessed by self-service.
Our cloud revenue in 2011 was more than three times
the prior year.
Our strong strategic positioning,
solid balance sheet, recurring
revenue, robust profit streams
and unmatched global
reach give us confidence that
we will achieve success in
the next five years, as we have
during the past decade.
4. Smarter Planet. All of this comes together in our
solutions to build Smarter Planet systems, transforming
systems such as supply chains, retail, energy, transportation,
telecommunications, food and water. It includes the
successful establishment of large new market categories,
such as Smarter Cities and Smarter Commerce. Smarter
Planet revenue grew by almost 50 percent in 2011.