IBM 2011 Annual Report Download - page 55
Download and view the complete annual report
Please find page 55 of the 2011 IBM annual report below. You can navigate through the pages in the report by either clicking on the pages listed below, or by using the keyword search tool below to find specific information within the annual report.-
 1
1 -
2
-
3
-
4
-
5
-
6
-
7
-
8
-
9
-
10
-
11
-
12
-
13
-
14
-
15
-
16
-
17
-
18
-
19
-
20
-
21
-
22
-
23
-
24
-
25
-
26
-
27
-
28
-
29
-
30
-
31
-
32
-
33
-
34
-
35
-
36
-
37
-
38
-
39
-
40
-
41
-
42
-
43
-
44
-
 45
45 -
 46
46 -
 47
47 -
 48
48 -
 49
49 -
 50
50 -
 51
51 -
 52
52 -
 53
53 -
 54
54 -
 55
55 -
 56
56 -
 57
57 -
 58
58 -
 59
59 -
 60
60 -
 61
61 -
 62
62 -
 63
63 -
 64
64 -
 65
65 -
66
-
67
-
68
-
69
-
70
-
71
-
72
-
73
-
74
-
75
-
76
-
77
-
78
-
79
-
80
-
81
-
82
-
83
-
84
-
85
-
86
-
87
-
88
-
89
-
90
-
91
-
92
-
93
-
94
-
95
-
96
-
97
-
98
-
99
-
100
-
101
-
102
-
103
-
104
-
105
-
106
-
107
-
108
-
109
-
110
-
111
-
112
-
113
-
114
-
115
-
116
-
117
-
118
-
119
-
120
-
121
-
122
-
123
-
124
-
125
-
126
-
127
-
128
-
129
-
130
-
131
-
132
-
133
-
134
-
135
-
136
-
137
-
138
-
139
-
140
-
141
-
142
-
143
-
144
-
145
-
146
-
147
-
148
 |
 |

53
Management Discussion
International Business Machines Corporation and Subsidiary Companies
currency impacts (up 1 point). RD&E investments represented
6.0 percent of total revenue in 2010, compared to 6.1 percent in 2009.
Operating (non-GAAP) RD&E expense increased 3.5 percent in 2010
compared to the prior year driven by the same factors.
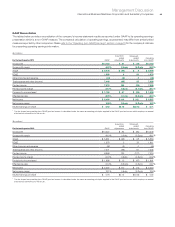
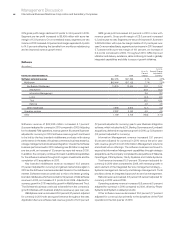
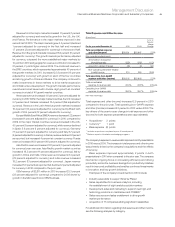
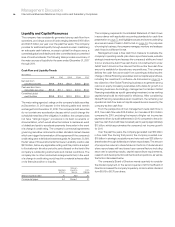
Intellectual Property and Custom Development Income
($ in millions)
For the year ended December 31: 2010 2009
Yr.-to-Yr.
Percent
Change
Sales and other transfers of
intellectual property $ 203 $ 228 (10.8)%
Licensing/royalty-based fees 312 370 (15.6)
Custom development income 638 579 10.3
To t a l $1,154 $1,177 (1.9)%
The timing and amount of sales and other transfers of IP may
vary significantly from period to period depending upon timing of
divestitures, industry consolidation, economic conditions and the
timing of new patents and know-how development. There were no
significant individual IP transactions in 2010 or 2009.
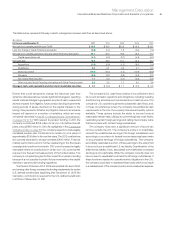
Interest Expense
($ in millions)
For the year ended December 31: 2010 2009
Yr.-to-Yr.
Percent
Change
Interest expense
To t a l $368 $402 (8.5)%
The decrease in interest expense was primarily due to lower average
interest rates in 2010 versus 2009, partially offset by higher average
debt balances in 2010 versus 2009. Total debt at December 31, 2010
was $28.6 billion; an increase of $2.5 billion from the prior year-end
position. Interest expense is presented in cost of financing in the
Consolidated Statement of Earnings if the related external borrowings
are to support the Global Financing external business. Overall interest
expense for 2010 was $923 million, a decrease of $185 million
versus 2009.
Income Taxes
The effective tax rate for 2010 was 24.8 percent, compared with
26.0 percent in 2009. The operating (non-GAAP) tax rate for 2010
was 24.4 percent compared to 25.8 percent in 2009. The 1.2 point
decrease in the as-reported effective tax rate was primarily driven
by a more favorable geographic mix of pre-tax income and incentives
(2.5 points), the increased utilization of foreign tax credits (4.1 points)
and the completion in 2010 of the U.S. federal income tax examination
for the years 2006 and 2007 including the associated reserve
redeterminations (6.4 points). These benefits were partially offset by
tax charges related to certain intercompany payments made by foreign
subsidiaries (6.6 points), the tax impact of certain business restructuring
transactions (2.7 points) and the tax costs associated with the
intercompany licensing of certain intellectual property (2.9 points).
The remaining items were individually insignificant.
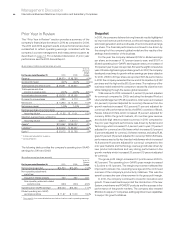
Financial Position
Key drivers in the company’s balance sheet and total cash flows in
2010 compared to 2009 are highlighted below.
Total assets increased $4,430 million ($3,609 million adjusted
for currency) from December 31, 2009, driven by:
• Increased goodwill ($4,946 million) and intangible assets
($975 million) driven by 2010 acquisitions;
• Higher level of total receivables ($1,337 million) and increased
total other assets ($679 million); partially offset by
• Decreases in cash and cash equivalents ($1,522 million)
and marketable securities ($800 million); and
• Lower total deferred taxes ($1,140 million).
Total liabilities increased $4,012 million ($3,673 million adjusted for
currency) from December 31, 2009 driven by:
• Higher total debt ($2,525 million);
• Increase in deferred income ($839 million); and an
• Increase in compensation and benefits ($523 million).
Total equity of $23,172 million increased $418 million from the prior
year-end balance as a result of:
• Higher retained earnings ($11,632 million);
• Increase in common stock ($3,608 million);
• Increase in foreign currency translation adjustments
($643 million); and an
• Increase in net unrealized gains on hedge of cash flow
derivatives ($385 million); partially offset by an
• Increase in treasury stock ($14,918 million); and
• Decrease in retirement-related items ($992 million).
The company generated $19,549 million in cash flow from operations,
a decrease of $1,224 million, compared to 2009, primarily driven by
a decrease in cash from total receivables ($2,620 million), partially
offset by the increase in net income ($1,408 million). Net cash used
in investing activities of $8,507 million was $1,778 million higher than
2009, primarily due to increased acquisitions ($4,728 million),
decreased cash from divestitures ($345 million) and increased net
capital spending ($299 million), partially offset by the year-to-year
net impacts related to marketable securities and other investments
($3,753 million).
Net cash used in financing activities of $12,429 million was
$2,271 million lower versus 2009, primarily due to the net benefit
from debt ($9,812 million) and an increase in cash from other
common stock transactions ($722 million), partially offset by higher
common stock repurchases ($7,946 million).