IBM 2011 Annual Report Download - page 65
Download and view the complete annual report
Please find page 65 of the 2011 IBM annual report below. You can navigate through the pages in the report by either clicking on the pages listed below, or by using the keyword search tool below to find specific information within the annual report.-
 1
1 -
2
-
3
-
4
-
5
-
6
-
7
-
8
-
9
-
10
-
11
-
12
-
13
-
14
-
15
-
16
-
17
-
18
-
19
-
20
-
21
-
22
-
23
-
24
-
25
-
26
-
27
-
28
-
29
-
30
-
31
-
32
-
33
-
34
-
35
-
36
-
37
-
38
-
39
-
40
-
41
-
42
-
43
-
44
-
45
-
46
-
47
-
48
-
49
-
50
-
51
-
52
-
53
-
54
-
 55
55 -
 56
56 -
 57
57 -
 58
58 -
 59
59 -
 60
60 -
 61
61 -
 62
62 -
 63
63 -
 64
64 -
 65
65 -
 66
66 -
 67
67 -
 68
68 -
 69
69 -
 70
70 -
 71
71 -
 72
72 -
 73
73 -
 74
74 -
 75
75 -
76
-
77
-
78
-
79
-
80
-
81
-
82
-
83
-
84
-
85
-
86
-
87
-
88
-
89
-
90
-
91
-
92
-
93
-
94
-
95
-
96
-
97
-
98
-
99
-
100
-
101
-
102
-
103
-
104
-
105
-
106
-
107
-
108
-
109
-
110
-
111
-
112
-
113
-
114
-
115
-
116
-
117
-
118
-
119
-
120
-
121
-
122
-
123
-
124
-
125
-
126
-
127
-
128
-
129
-
130
-
131
-
132
-
133
-
134
-
135
-
136
-
137
-
138
-
139
-
140
-
141
-
142
-
143
-
144
-
145
-
146
-
147
-
148
 |
 |

63
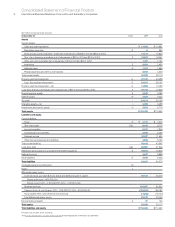
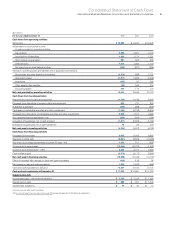
Management Discussion
International Business Machines Corporation and Subsidiary Companies
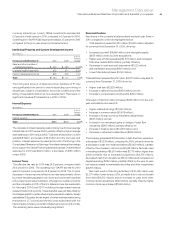
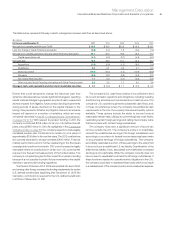
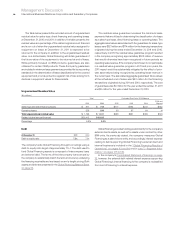
Employees and Related Workforce
Yr.-to-Yr. Change
For the year ended December 31: 2011 2010 2009 2011-10 2010-09
IBM/wholly owned subsidiaries 433,362 426,751 399,409 1.5%6.8%
Less-than-wholly owned subsidiaries 7,523 9,334 11,421 (19.4) (18.3)
Complementary 25,500 27,784 26,946 (8.2)3.1
As a globally integrated enterprise, the company operates in over
170 countries and is continuing to shift its business to the higher
value segments of enterprise computing. The company continually
assesses its resource needs with the objective of balancing its
workforce globally to improve the company’s global reach and
competitiveness. In 2011, total employees at IBM and its wholly owned
subsidiaries increased more than 6,500 compared to the prior year.
The complementary workforce is an approximation of equivalent
full-time employees hired under temporary, part-time and limited
term employment arrangements to meet specific business needs
in a flexible and cost-effective manner.
Global Financing
Global Financing is a reportable segment that is measured as a
stand-alone entity.
In 2011, as the global economy continued to face a challenging
credit environment, the Global Financing business remained focused
on its core competencies—providing IT financing to the company’s
clients and business partners. For the year, Global Financing increased
total revenue by 2.8 percent and improved total gross margin by
1.2 points, while the pre-tax income margin was essentially flat year
to year. Total pre-tax income of $2,011 million increased 2.8 percent
compared to 2010.
In addition to the overall health of the economy and its impact
on corporate IT budgets, key drivers of Global Financing’s results
are interest rates and originations. Interest rates directly impact Global
Financing’s business by increasing or decreasing both financing
revenue and the associated borrowing costs. Originations, which
determine the asset base of Global Financing’s annuity-like business,
are impacted by IBM’s non-Global Financing sales and services
volumes and Global Financing’s participation rates. Participation
rates are the propensity of IBM’s clients to finance their transactions
through Global Financing in lieu of paying IBM up-front cash or
financing through a third party.
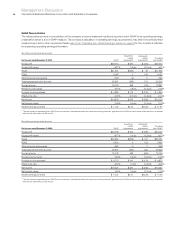
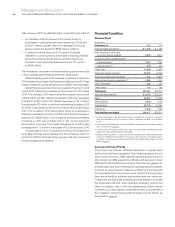
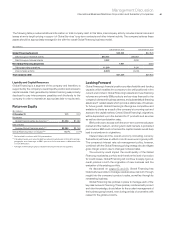
Results of Operations
($ in millions)
For the year ended December 31: 2011 2010*2009*
External revenue $2,102 $2,238 $2,302
Internal revenue 2,092 1,842 1,774
Total revenue 4,195 4,080 4,076
Cost 1,467 1,474 1,555
Gross profit $2,728 $2,606 $2,520
Gross profit margin 65.0% 63.9%61.8%
Pre-tax income $2,011 $1,956 $1,724
After-tax income** $1,338 $1,292 $1,132
Return on equity** 40.7% 41.1%34.2%
* Reclassified to conform with 2011 presentation.
**
See page 67 for the details of the after-tax income and return on equity calculation.
Total revenue in 2011 increased $115 million versus 2010 as a result of:
• An increase in internal revenue of 13.6 percent primarily
driven by an increase in used equipment sales revenue
(up 19.7 percent to $1,528 million); partially offset by
• A decline in external revenue of 6.1 percent (9 percent
adjusted for currency) driven by a decrease in used equipment
sales revenue (down 25.5 percent to $490 million), partially
offset by an increase in financing revenue (up 2.0 percent to
$1,612 million).
The increase in external financing revenue was due to higher average
asset balance and an increase in remarketing lease revenue.
Global Financing gross profit increased 4.7 percent compared
to 2010 due to higher used equipment sales and financing gross
profit. Gross margin increased 1.2 points primarily due to a higher
used equipment sales margin.