IBM 2011 Annual Report Download - page 119
Download and view the complete annual report
Please find page 119 of the 2011 IBM annual report below. You can navigate through the pages in the report by either clicking on the pages listed below, or by using the keyword search tool below to find specific information within the annual report.-
 1
1 -
2
-
3
-
4
-
5
-
6
-
7
-
8
-
9
-
10
-
11
-
12
-
13
-
14
-
15
-
16
-
17
-
18
-
19
-
20
-
21
-
22
-
23
-
24
-
25
-
26
-
27
-
28
-
29
-
30
-
31
-
32
-
33
-
34
-
35
-
36
-
37
-
38
-
39
-
40
-
41
-
42
-
43
-
44
-
45
-
46
-
47
-
48
-
49
-
50
-
51
-
52
-
53
-
54
-
55
-
56
-
57
-
58
-
59
-
60
-
61
-
62
-
63
-
64
-
65
-
66
-
67
-
68
-
69
-
70
-
71
-
72
-
73
-
74
-
75
-
76
-
77
-
78
-
79
-
80
-
81
-
82
-
83
-
84
-
85
-
86
-
87
-
88
-
89
-
90
-
91
-
92
-
93
-
94
-
95
-
96
-
97
-
98
-
99
-
100
-
101
-
102
-
103
-
104
-
105
-
106
-
107
-
108
-
 109
109 -
 110
110 -
 111
111 -
 112
112 -
 113
113 -
 114
114 -
 115
115 -
 116
116 -
 117
117 -
 118
118 -
 119
119 -
 120
120 -
 121
121 -
 122
122 -
 123
123 -
 124
124 -
 125
125 -
 126
126 -
 127
127 -
 128
128 -
 129
129 -
130
-
131
-
132
-
133
-
134
-
135
-
136
-
137
-
138
-
139
-
140
-
141
-
142
-
143
-
144
-
145
-
146
-
147
-
148
 |
 |

Notes to Consolidated Financial Statements
International Business Machines Corporation and Subsidiary Companies 117
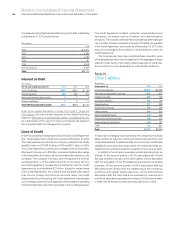
Within the next 12 months, the company believes it is reasonably
possible that the total amount of unrecognized tax benefits associated
with certain positions may be reduced. The company expects that
certain foreign and state issues may be concluded in the next
12 months. The company estimates that the unrecognized tax benefits
at December 31, 2011 could be reduced by $138 million.
With limited exception, the company is no longer subject to U.S.
federal, state and local or non-U.S. income tax audits by taxing
authorities for years through 2007. The years subsequent to 2007
contain matters that could be subject to differing interpretations of
applicable tax laws and regulations as it relates to the amount and/
or timing of income, deductions and tax credits. Although the
outcome of tax audits is always uncertain, the company believes
that adequate amounts of tax and interest have been provided for
any adjustments that are expected to result for these years.
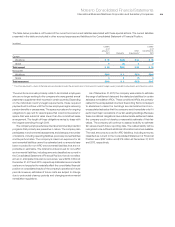
The company has not provided deferred taxes on $37.9 billion
of undistributed earnings of non-U.S. subsidiaries at December 31, 2011,
as it is the company’s policy to indefinitely reinvest these earnings
in non-U.S. operations. However, the company periodically repatriates
a portion of these earnings to the extent that it does not incur an
additional U.S. tax liability. Quantification of the deferred tax liability,
if any, associated with indefinitely reinvested earnings is not practicable.
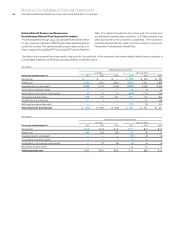
Note O.
Research, Development and Engineering
RD&E expense was $6,258 million in 2011, $6,026 million in 2010
and $5,820 million in 2009.
The company incurred expense of $5,990 million, $5,720 million
and $5,523 million in 2011, 2010 and 2009, respectively, for scientific
research and the application of scientific advances to the development
of new and improved products and their uses, as well as services
and their application. Within these amounts, software-related expense
was $3,097 million, $3,028 million and $2,991 million in 2011, 2010
and 2009, respectively.
Expense for product-related engineering was $267 million,
$306 million and $297 million in 2011, 2010 and 2009, respectively.
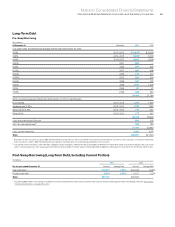
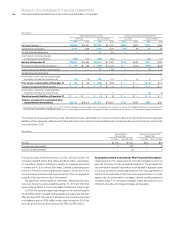
Note P.
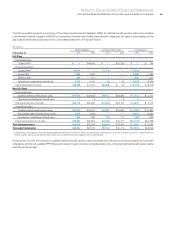
Earnings Per Share of Common Stock
The following table presents the computation of basic and diluted earnings per share of common stock.
($ in millions except per share amounts)
For the year ended December 31: 2011 2010 2009
Weighted-average number of shares on which earnings per share calculations are based:
Basic 1,196,951,006 1,268,789,202 1,327,157,410
Add—incremental shares under stock-based compensation plans 14,241,131 16,189,053 12,258,864
Add—incremental shares associated with contingently issuable shares 2,575,848 2,377,133 1,936,480
Assuming dilution 1,213,767,985 1,287,355,388 1,341,352,754
Net income on which basic earnings per share is calculated $15,855 $14,833 $13,425
Less—net income applicable to contingently issuable shares 00 —
Net income on which diluted earnings per share is calculated $15,855 $14,833 $13,425
Earnings/(loss) per share of common stock
Assuming dilution $ 13.06 $ 11.52 $ 10.01
Basic $ 13.25 $ 11.69 $ 10.12
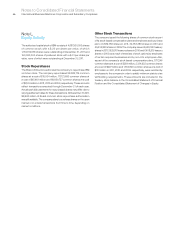
Stock options to purchase 612,272 common shares in 2009 were outstanding, but were not included in the computation of diluted earnings
per share because the exercise price of the options was greater than the average market price of the common shares for the applicable full
year, and therefore, the effect would have been antidilutive.