IBM 2011 Annual Report Download - page 54
Download and view the complete annual report
Please find page 54 of the 2011 IBM annual report below. You can navigate through the pages in the report by either clicking on the pages listed below, or by using the keyword search tool below to find specific information within the annual report.-
 1
1 -
2
-
3
-
4
-
5
-
6
-
7
-
8
-
9
-
10
-
11
-
12
-
13
-
14
-
15
-
16
-
17
-
18
-
19
-
20
-
21
-
22
-
23
-
24
-
25
-
26
-
27
-
28
-
29
-
30
-
31
-
32
-
33
-
34
-
35
-
36
-
37
-
38
-
39
-
40
-
41
-
42
-
43
-
 44
44 -
 45
45 -
 46
46 -
 47
47 -
 48
48 -
 49
49 -
 50
50 -
 51
51 -
 52
52 -
 53
53 -
 54
54 -
 55
55 -
 56
56 -
 57
57 -
 58
58 -
 59
59 -
 60
60 -
 61
61 -
 62
62 -
 63
63 -
 64
64 -
65
-
66
-
67
-
68
-
69
-
70
-
71
-
72
-
73
-
74
-
75
-
76
-
77
-
78
-
79
-
80
-
81
-
82
-
83
-
84
-
85
-
86
-
87
-
88
-
89
-
90
-
91
-
92
-
93
-
94
-
95
-
96
-
97
-
98
-
99
-
100
-
101
-
102
-
103
-
104
-
105
-
106
-
107
-
108
-
109
-
110
-
111
-
112
-
113
-
114
-
115
-
116
-
117
-
118
-
119
-
120
-
121
-
122
-
123
-
124
-
125
-
126
-
127
-
128
-
129
-
130
-
131
-
132
-
133
-
134
-
135
-
136
-
137
-
138
-
139
-
140
-
141
-
142
-
143
-
144
-
145
-
146
-
147
-
148
 |
 |

52
Management Discussion
International Business Machines Corporation and Subsidiary Companies
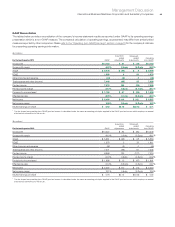
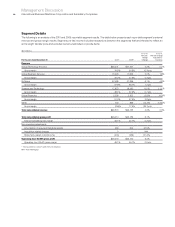
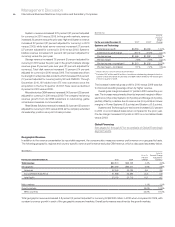
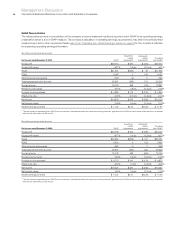
Other (Income) and Expense
($ in millions)
For the year ended December 31: 2010 2009
Yr.-to-Yr.
Percent
Change
Other (income) and expense
Foreign currency transaction
losses/(gains) $ 303 $ (1) NM
(Gains)/losses on
derivative instruments (239) (12)NM
Interest income (92) (94)(2.3)%
Net (gains)/losses from securities
and investment assets 31 112 (72.1)
Other (790)(357)121.2
Total consolidated other
(income) and expense $(787)$(351)124.5%
Non-operating adjustment
Acquisition-related charges (4) (1) 27 7.4
Operating (non-GAAP) other
(income) and expense $(791)$(352)125.0%
NM—Not meaningful
Other (income) and expense was income of $787 million in 2010, an
increase in income of $436 million year to year. The increase in
income was primarily driven by several key factors reflected in Other
in the table above: the net gain from the PLM transaction in the first
quarter of 2010 ($591 million); a net gain associated with the disposition
of a joint venture in third quarter of 2010 ($57 million) versus a gain
from the divestiture of the core logistics operations to Geodis in the
first quarter of 2009 ($298 million); and a provision for losses related
to a joint venture investment ($119 million) recorded in the second
quarter of 2009. In addition, foreign currency rate volatility drove higher
foreign currency transaction losses ($304 million) and increased gains
on derivative instruments ($227 million). Operating (non-GAAP) other
(income) and expense reflected increased income of $439 million in
2010 compared to 2009 driven by the same factors.
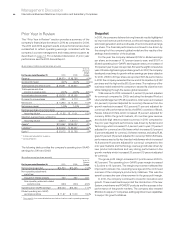
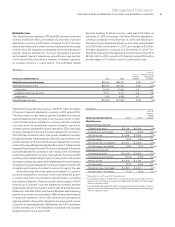
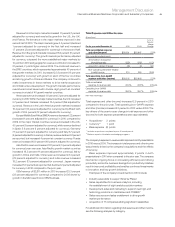
Research, Development and Engineering
($ in millions)
For the year ended December 31: 2010 2009
Yr.-to-Yr.
Percent
Change
Total consolidated research,
development and engineering $6,026 $5,820 3.5%
Non-operating adjustment
Non-operating retirement-related
(costs)/income 126 123 2.6
Operating (non-GAAP) research,
development and engineering $6,152 $5,943 3.5%
The company continued to invest in research and development,
focusing its investments on high-value, high-growth opportunities
and to extend its technology leadership. Total research, development
and engineering (RD&E) expense increased 3.5 percent in 2010
versus 2009, primarily driven by acquisitions (up 2 points) and
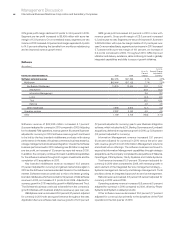
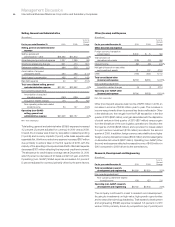
Selling, General and Administrative
($ in millions)
For the year ended December 31: 2010 2009
Yr.-to-Yr.
Percent
Change
Selling, general and administrative
expense
Selling, general and
administrative—other $18,585 $17,872 4.0%
Advertising and promotional expense 1,337 1,255 6.6
Workforce rebalancing charges 641 474 35.3
Retirement-related costs 494 503 (1.7)
Amortization of acquired
intangibles assets 253 285 (11.3)
Stock-based compensation 488 417 16.9
Bad debt expense 40 147 (72.5)
Total consolidated selling, general
and administrative expense $21,837 $20,952 4.2%
Non-operating adjustments
Amortization of acquired
intangible assets (253) (285) (11.3)
Acquisition-related charges (41)(8)NM
Non-operating retirement-related
(costs)/income 84 127 (33.8)
Operating (non-GAAP)
selling, general and
administrative expense $21,628 $20,787 4.0%
NM—Not meaningful
Total selling, general and administrative (SG&A) expense increased
4.2 percent (3 percent adjusted for currency) in 2010 versus 2009.
Overall, the increase was driven by acquisition-related spending
(3 points) and currency impacts (1 point), while base expense was
essentially flat. Workforce reductions expense increased $167 million
due primarily to actions taken in the first quarter of 2010, with the
majority of the spending in Europe and Asia Pacific. Bad debt expense
decreased $107 million reflecting the improved credit environment.
The allowance for credit losses coverage rate at December 31, 2010
was 1.8 percent, a decrease of 20 basis points from year-end 2009.
Operating (non-GAAP) SG&A expense increased 4.0 percent
(3 percent adjusted for currency) primarily driven by the same factors.