IBM 2011 Annual Report Download - page 51
Download and view the complete annual report
Please find page 51 of the 2011 IBM annual report below. You can navigate through the pages in the report by either clicking on the pages listed below, or by using the keyword search tool below to find specific information within the annual report.-
 1
1 -
2
-
3
-
4
-
5
-
6
-
7
-
8
-
9
-
10
-
11
-
12
-
13
-
14
-
15
-
16
-
17
-
18
-
19
-
20
-
21
-
22
-
23
-
24
-
25
-
26
-
27
-
28
-
29
-
30
-
31
-
32
-
33
-
34
-
35
-
36
-
37
-
38
-
39
-
40
-
 41
41 -
 42
42 -
 43
43 -
 44
44 -
 45
45 -
 46
46 -
 47
47 -
 48
48 -
 49
49 -
 50
50 -
 51
51 -
 52
52 -
 53
53 -
 54
54 -
 55
55 -
 56
56 -
 57
57 -
 58
58 -
 59
59 -
 60
60 -
 61
61 -
62
-
63
-
64
-
65
-
66
-
67
-
68
-
69
-
70
-
71
-
72
-
73
-
74
-
75
-
76
-
77
-
78
-
79
-
80
-
81
-
82
-
83
-
84
-
85
-
86
-
87
-
88
-
89
-
90
-
91
-
92
-
93
-
94
-
95
-
96
-
97
-
98
-
99
-
100
-
101
-
102
-
103
-
104
-
105
-
106
-
107
-
108
-
109
-
110
-
111
-
112
-
113
-
114
-
115
-
116
-
117
-
118
-
119
-
120
-
121
-
122
-
123
-
124
-
125
-
126
-
127
-
128
-
129
-
130
-
131
-
132
-
133
-
134
-
135
-
136
-
137
-
138
-
139
-
140
-
141
-
142
-
143
-
144
-
145
-
146
-
147
-
148
 |
 |

49
Management Discussion
International Business Machines Corporation and Subsidiary Companies
($ in millions)
For the year ended December 31: 2010*2009*
Yr.-to-Yr.
Percent/
Margin
Change
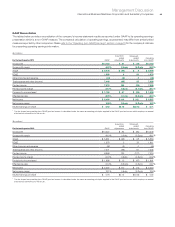
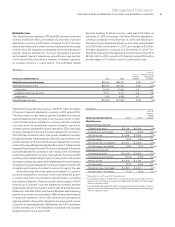
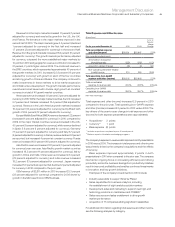
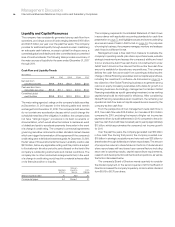
Software
External gross profit $19,774 $18,553 6.6%
External gross profit margin 87.9% 86.7% 1.2 pts.
Pre-tax income $ 9,466 $ 8,319 13.8%
Pre-tax margin 37.2% 34.6%2.7 pts.
Pre-tax income-normalized** $ 8,972 $ 8,229 9.0%
Pre-tax margin—normalized 35.3%34.2%1.1 pts.
* Reclassified to conform with 2011 presentation.
**
Excludes $98 million and $17 million of workforce rebalancing charges in the first
quarter of 2010 and 2009, respectively, and $(591) million related to the PLM gain in
the first quarter of 2010 and $(106) million related to the Geodis gain in the first quarter
of 2009.
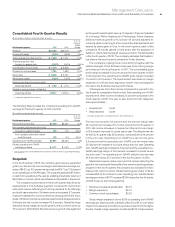
Software gross profit of $19,774 million in 2010 increased 6.6 percent
versus 2009, driven primarily by the year-to-year growth in software
revenue. The improvement in the gross profit margin was primarily
driven by the divestiture of the lower gross margin PLM revenue.
The Software segment delivered $9,466 million of pre-tax profit in
2010, an increase of $1,147 million, or 13.8 percent, versus 2009. The
segment pre-tax profit margin expanded 2.7 points to 37.2 percent.
On a normalized basis, segment pre-tax income increased 9.0 percent
and segment pre-tax margin expanded 1.1 points to 35.3 percent.
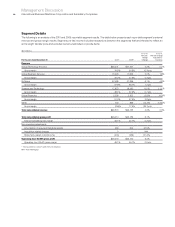
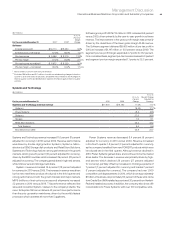
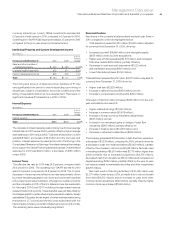
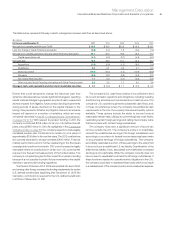
Systems and Technology
($ in millions)
For the year ended December 31: 2010 2009
Yr.-to-Yr.
Percent
Change
Yr.-to-Yr.
Percent Change
Adjusted for
Currency
Systems and Technology external revenue $17,973 $16,190 11.0% 11.1%
System z 16.4% 17.7%
Power Systems (8.4) (8.5)
System x 27.5 26.8
Storage 7.6 8.1
Retail Store Solutions 22.4 23.2
Total Systems 9.5 9.6
Microelectronics OEM 24.8 24.7
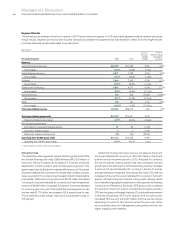
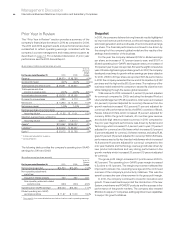
Systems and Technology revenue increased 11.0 percent (11 percent
adjusted for currency) in 2010 versus 2009. Revenue performance
was driven by double-digit growth in System z, System x, Micro-
electronics OEM, Storage disk products and Retail Store Solutions.
Systems and Technology had very strong performance in the growth
markets, which grew 20 percent (19 percent adjusted for currency),
driven by the BRIC countries which increased 29 percent (28 percent
adjusted for currency). The company gained share in high-end servers,
while total servers and storage held share.
System z revenue increased 16.4 percent (18 percent adjusted
for currency) in 2010 versus 2009. The increase in revenue was driven
by the new mainframe product introduced in the third quarter and
strong performance in both the growth markets and major markets.
MIPS (millions of instructions per second) shipments increased
22 percent in 2010 versus 2009. This performance reflected the
value and innovation System z delivers to the company’s clients. The
new z Enterprise 196 server delivers 40 percent more performance
than the prior generation mainframe, driven by the world’s fastest
processor which operates at more than 5 gigahertz.
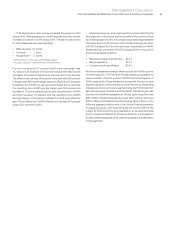
Power Systems revenue decreased 8.4 percent (9 percent
adjusted for currency) in 2010 versus 2009. Revenue increased
in the fourth quarter 1.8 percent (3 percent adjusted for currency)
as the company benefited from new POWER7 products which were
introduced late in the third quarter. Although revenue declined in
2010, Power Systems gained share and continued to be the market
share leader. The decrease in revenue was primarily driven by high-
end servers which declined 26 percent (27 percent adjusted
for currency), partially offset by increases in midrange systems of
7 percent (7 percent adjusted for currency) and blades 7 percent
(7 percent adjusted for currency). The company had over 1,000
competitive unit displacements in 2010, which drove approximately
$1 billion of business. Approximately 60 percent of these wins came
from Oracle/Sun UNIX installed accounts and 30 percent from Hewlett-
Packard installed accounts. In addition, the company also drove x86
consolidations to Power Systems, with over 100 competitive wins.