IBM 2011 Annual Report Download - page 46
Download and view the complete annual report
Please find page 46 of the 2011 IBM annual report below. You can navigate through the pages in the report by either clicking on the pages listed below, or by using the keyword search tool below to find specific information within the annual report.-
 1
1 -
2
-
3
-
4
-
5
-
6
-
7
-
8
-
9
-
10
-
11
-
12
-
13
-
14
-
15
-
16
-
17
-
18
-
19
-
20
-
21
-
22
-
23
-
24
-
25
-
26
-
27
-
28
-
29
-
30
-
31
-
32
-
33
-
34
-
35
-
 36
36 -
 37
37 -
 38
38 -
 39
39 -
 40
40 -
 41
41 -
 42
42 -
 43
43 -
 44
44 -
 45
45 -
 46
46 -
 47
47 -
 48
48 -
 49
49 -
 50
50 -
 51
51 -
 52
52 -
 53
53 -
 54
54 -
 55
55 -
 56
56 -
57
-
58
-
59
-
60
-
61
-
62
-
63
-
64
-
65
-
66
-
67
-
68
-
69
-
70
-
71
-
72
-
73
-
74
-
75
-
76
-
77
-
78
-
79
-
80
-
81
-
82
-
83
-
84
-
85
-
86
-
87
-
88
-
89
-
90
-
91
-
92
-
93
-
94
-
95
-
96
-
97
-
98
-
99
-
100
-
101
-
102
-
103
-
104
-
105
-
106
-
107
-
108
-
109
-
110
-
111
-
112
-
113
-
114
-
115
-
116
-
117
-
118
-
119
-
120
-
121
-
122
-
123
-
124
-
125
-
126
-
127
-
128
-
129
-
130
-
131
-
132
-
133
-
134
-
135
-
136
-
137
-
138
-
139
-
140
-
141
-
142
-
143
-
144
-
145
-
146
-
147
-
148
 |
 |

44
Management Discussion
International Business Machines Corporation and Subsidiary Companies
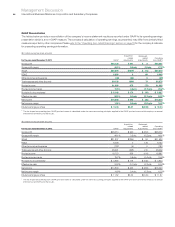
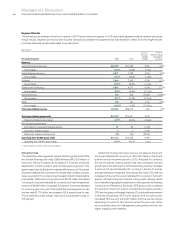
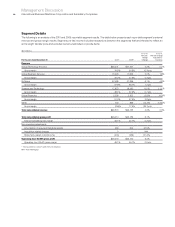
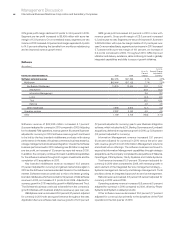
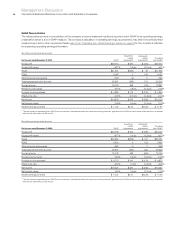
Prior Year in Review
The “Prior Year in Review” section provides a summary of the
company’s financial performance in 2010 as compared to 2009.
The 2010 and 2009 segment results and performance have been
reclassified to reflect operating earnings, consistent with the
company’s current management and measurement system as
described on page 18. For a detailed discussion of prior year
performance, see the 2010 Annual Report.
($ and shares in millions except per share amounts)
For the year ended December 31: 2010 2009
Yr.-to-Yr.
Percent/
Margin
Change
Revenue $ 99,870 $ 95,758 4.3%*
Gross profit margin 46.1% 45.7% 0.3 pts.
Total expense and other income $ 26,291 $ 25,647 2.5%
Total expense and other
income-to-revenue ratio 26.3% 26.8%(0.5) pts.
Income before income taxes $ 19,723 $ 18,138 8.7%
Provision for income taxes 4,890 4,713 3.8%
Net income $ 14,833 $ 13,425 10.5%
Net income margin 14.9% 14.0%0.8 pts.
Earnings per share of common stock
Assuming dilution $ 11.52 $ 10.01 15.1%
Weighted-average shares outstanding
Assuming dilution 1,287.4 1,341.4 (4.0)%
Assets** $113,452 $109,022 4.1%
Liabilities** $ 90,279 $ 86,267 4.7%
Equity** $ 23,172 $ 22,755 1.8%
* 3.3 percent adjusted for currency.
** At December 31.
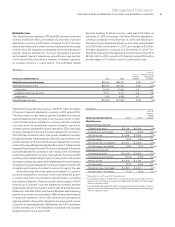
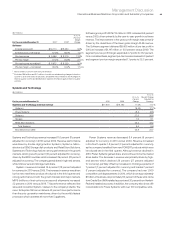
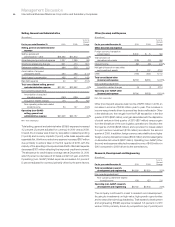
The following table provides the company’s operating (non-GAAP)
earnings for 2010 and 2009.
($ in millions except per share amounts)
For the year ended December 31: 2010 2009
Yr.-to-Yr.
Percent
Change
Net income as reported $14,833 $13,425 10.5%
Non-operating adjustments
(net of tax)
Acquisition-related charges 443 357 24.1
Non-operating retirement-related
costs/(income) (253) (330)(23.5)
Operating (non-GAAP) earnings* $15,023 $13,452 11.7%
Diluted operating (non-GAAP)
earnings per share $ 11.67 $ 10.03 16.4%
* See page 54 for a more detailed reconciliation of net income to operating earnings.
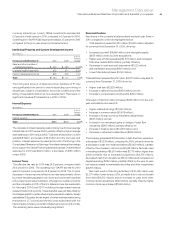
Snapshot
In 2010, the company delivered strong financial results highlighted
by improved revenue performance, continued margin expansion,
solid cash generation and record levels of net income and earnings
per share. The financial performance continued to be driven by
the strength of the company’s global model and the results of the
strategic transformation of the business.
For the year, the company delivered $11.52 in diluted earnings
per share, an increase of 15.1 percent year to year, and $11.67 in
diluted operating (non-GAAP) earnings per share, an increase of
16.4 percent year to year. As reported, this was the eighth consecutive
year of double-digit earnings per share growth. In 2007, the company
developed a road map for growth with an earnings per share objective
for 2010 of $10 to $11 per share as reported. With its performance
in 2010, the company exceeded the low end of its objective by $1.52
per share and the high end by $0.52 per share. The resilience of the
business model enabled the company to exceed its objective even
while managing through the severe global recession.
Total revenue for 2010 increased 4.3 percent (3 percent adjusted
for currency) compared to 2009; excluding the divested Product
Lifecycle Management (PLM) operations, total revenue increased
4.9 percent (4 percent adjusted for currency). Revenue from the
growth markets increased 16.0 percent (11 percent adjusted for
currency) with performance led by the BRIC countries of Brazil,
Russia, India and China which increased 18 percent, adjusted for
currency. Within the growth markets, 40 countries grew revenue
at a double-digit rate at constant currency in 2010 compared to
the prior year. Segment performance was driven by Systems and
Technology which increased 11.0 percent year to year (11 percent
adjusted for currency) and Software which increased 5.1 percent
(5 percent adjusted for currency). Software revenue, excluding PLM,
grew 8.1 percent (8 percent adjusted for currency). Within Software,
performance was led by key branded middleware which increased
10.8 percent (11 percent adjusted for currency) compared to the
prior year. Systems and Technology revenue growth was driven by
new product introductions and very strong performance in the
growth markets which increased 20 percent (19 percent adjusted
for currency).
The gross profit margin increased 0.3 points versus 2009 to
46.1 percent. The operating (non-GAAP) gross margin increased
0.5 points to 46.1 percent. The margin improvement reflected the
improved business mix, operating leverage and the continued
success of the company’s productivity initiatives. This was the
seventh consecutive year of improvement in the gross profit margin.
In 2010, the company continued to invest for innovation and
growth. These investments supported the introduction of the new
System z mainframe and POWER7 products and the success in the
performance of the growth markets. The company also invested
$6 billion to acquire 17 companies, adding significant new capabilities
to support its growth initiatives.