IBM 2011 Annual Report Download - page 39
Download and view the complete annual report
Please find page 39 of the 2011 IBM annual report below. You can navigate through the pages in the report by either clicking on the pages listed below, or by using the keyword search tool below to find specific information within the annual report.-
 1
1 -
2
-
3
-
4
-
5
-
6
-
7
-
8
-
9
-
10
-
11
-
12
-
13
-
14
-
15
-
16
-
17
-
18
-
19
-
20
-
21
-
22
-
23
-
24
-
25
-
26
-
27
-
28
-
 29
29 -
 30
30 -
 31
31 -
 32
32 -
 33
33 -
 34
34 -
 35
35 -
 36
36 -
 37
37 -
 38
38 -
 39
39 -
 40
40 -
 41
41 -
 42
42 -
 43
43 -
 44
44 -
 45
45 -
 46
46 -
 47
47 -
 48
48 -
 49
49 -
50
-
51
-
52
-
53
-
54
-
55
-
56
-
57
-
58
-
59
-
60
-
61
-
62
-
63
-
64
-
65
-
66
-
67
-
68
-
69
-
70
-
71
-
72
-
73
-
74
-
75
-
76
-
77
-
78
-
79
-
80
-
81
-
82
-
83
-
84
-
85
-
86
-
87
-
88
-
89
-
90
-
91
-
92
-
93
-
94
-
95
-
96
-
97
-
98
-
99
-
100
-
101
-
102
-
103
-
104
-
105
-
106
-
107
-
108
-
109
-
110
-
111
-
112
-
113
-
114
-
115
-
116
-
117
-
118
-
119
-
120
-
121
-
122
-
123
-
124
-
125
-
126
-
127
-
128
-
129
-
130
-
131
-
132
-
133
-
134
-
135
-
136
-
137
-
138
-
139
-
140
-
141
-
142
-
143
-
144
-
145
-
146
-
147
-
148
 |
 |

37
Management Discussion
International Business Machines Corporation and Subsidiary Companies
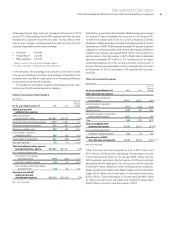
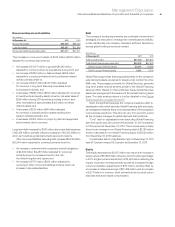
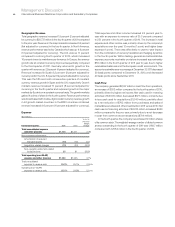
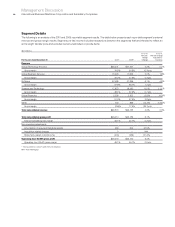
Noncurrent Assets and Liabilities
($ in millions)
At December 31: 2011 2010
Noncurrent assets $65,505 $65,335
Long-term debt $22,857 $21,846
Noncurrent liabilities (excluding debt) $31,217 $27,871
The increase in noncurrent assets of $169 million ($902 million
adjusted for currency) was driven by:
• An increase of $1,077 million in goodwill ($1,282 million
adjusted for currency) driven by acquisitions during 2011; and
• An increase of $282 million in deferred taxes ($256 million
adjusted for currency) primarily driven by retirement related
activity; partially offset by
• An increase of $227 million ($330 million adjusted
for currency) in long-term financing receivables driven
by increased volumes; and
• A decrease of $883 million ($753 million adjusted for currency)
in investments and sundry assets driven by net asset sales of
$395 million during 2011 as well as a reclass to short-term
other receivables of approximately $300 million to reflect
maturity dates; and
• A decrease of $225 million ($66 million adjusted
for currency) in prepaid pension assets resulting from
pension remeasurements; and
• A decrease of $214 million in property, plant and equipment
(net) primarily due to currency.
Long-term debt increased by $1,011 million due to new debt issuances
of $5,194 million, partially offset by reclasses of $4,325 million to
short-term debt as certain instruments approach maturity.
Other noncurrent liabilities, excluding debt, increased $3,346 million
($3,544 million adjusted for currency) primarily driven by:
• An increase in retirement and nonpension benefit obligations
of $2,396 million ($2,488 million adjusted for currency)
primarily driven by remeasurements in the U.S.,
the United Kingdom and Japan; and
• An increase of $770 million ($834 million adjusted for
currency) in other noncurrent liabilities primarily due to an
increase in tax related liabilities.
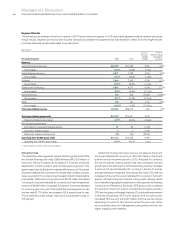
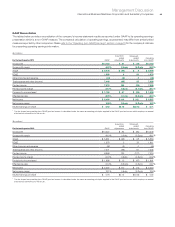
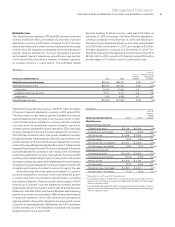
Debt
The company’s funding requirements are continually monitored and
strategies are executed to manage the overall asset and liability
profile. Additionally, the company maintains sufficient flexibility to
access global funding sources as needed.
($ in millions)
At December 31: 2011 2010
Total company debt $31,320 $28,624
Total Global Financing segment debt $23,332 $22,823
Debt to support external clients 20,051 19,583
Debt to support internal clients 3,281 3,240
Global Financing provides financing predominantly for the company’s
external client assets, as well as for assets under contract by other
IBM units. These assets, primarily for Global Services, generate
long-term, stable revenue streams similar to the Global Financing
asset portfolio. Based on their attributes, these Global Services
assets are leveraged with the balance of the Global Financing asset
base. The debt analysis above is further detailed in the Global
Financing section on pages 66 and 67.
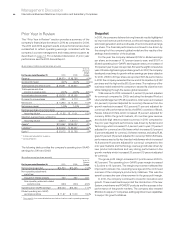
Given the significant leverage, the company presents a debt-to-
capitalization ratio which excludes Global Financing debt and equity
as management believes this is more representative of the company’s
core business operations. This ratio can vary from period to period
as the company manages its global cash and debt positions.
“Core” debt-to-capitalization ratio (excluding Global Financing
debt and equity) was 32.0 percent at December 31, 2011 compared
to 22.6 percent at December 31, 2010. The increase was primarily
driven by an increase in non-Global Financing debt of $2,186 million
and by a decrease in non-Global Financing equity of $2,929 million
from December 31, 2010 balances.
Consolidated debt-to-capitalization ratio at December 31, 2011
was 60.7 percent versus 55.3 percent at December 31, 2010.
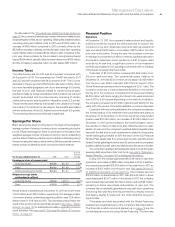
Equity
Total equity decreased by $2,937 million as a result of an increase in
treasury stock of $14,803 million, driven by common stock repurchases
in 2011; a higher pension adjustment of $2,448 million reflecting the
impact of pension remeasurements as well as increased foreign
currency translation adjustments of $711 million; partially offset by
an increase in retained earnings of $12,326 million, and an increase
of $2,711 million in common stock primarily driven by stock option
exercises and stock based compensation.