IBM 2011 Annual Report Download - page 104
Download and view the complete annual report
Please find page 104 of the 2011 IBM annual report below. You can navigate through the pages in the report by either clicking on the pages listed below, or by using the keyword search tool below to find specific information within the annual report.-
 1
1 -
2
-
3
-
4
-
5
-
6
-
7
-
8
-
9
-
10
-
11
-
12
-
13
-
14
-
15
-
16
-
17
-
18
-
19
-
20
-
21
-
22
-
23
-
24
-
25
-
26
-
27
-
28
-
29
-
30
-
31
-
32
-
33
-
34
-
35
-
36
-
37
-
38
-
39
-
40
-
41
-
42
-
43
-
44
-
45
-
46
-
47
-
48
-
49
-
50
-
51
-
52
-
53
-
54
-
55
-
56
-
57
-
58
-
59
-
60
-
61
-
62
-
63
-
64
-
65
-
66
-
67
-
68
-
69
-
70
-
71
-
72
-
73
-
74
-
75
-
76
-
77
-
78
-
79
-
80
-
81
-
82
-
83
-
84
-
85
-
86
-
87
-
88
-
89
-
90
-
91
-
92
-
93
-
 94
94 -
 95
95 -
 96
96 -
 97
97 -
 98
98 -
 99
99 -
 100
100 -
 101
101 -
 102
102 -
 103
103 -
 104
104 -
 105
105 -
 106
106 -
 107
107 -
 108
108 -
 109
109 -
 110
110 -
 111
111 -
 112
112 -
 113
113 -
 114
114 -
115
-
116
-
117
-
118
-
119
-
120
-
121
-
122
-
123
-
124
-
125
-
126
-
127
-
128
-
129
-
130
-
131
-
132
-
133
-
134
-
135
-
136
-
137
-
138
-
139
-
140
-
141
-
142
-
143
-
144
-
145
-
146
-
147
-
148
 |
 |

Notes to Consolidated Financial Statements
International Business Machines Corporation and Subsidiary Companies102
($ in millions)
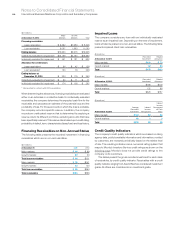
At December 31, 2010:
Major
Markets
Growth
Markets To ta l
Financing receivables
Lease receivables $ 6,562 $1,983 $ 8,545
Loan receivables 9,087 1,993 11,080
Ending balance $15,650 $3,975 $19,625
Collectively evaluated for impairment $15,199 $3,794 $18,993
Individually evaluated for impairment $ 451 $ 181 $ 632
Allowance for credit losses
Lease receivables* $ 84 $ 42 $ 126
Loan receivables* 150 76 226
Ending balance at
December 31, 2010 $ 234 $ 119 $ 353
Collectively evaluated for impairment $ 60 $ 11 $ 71
Individually evaluated for impairment $ 174 $ 108 $ 282
* Reclassified to conform with 2011 presentation.
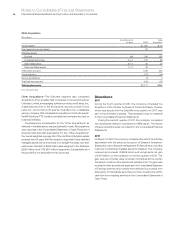
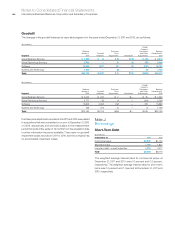
When determining the allowances, financing receivables are evaluated
either on an individual or a collective basis. For individually evaluated
receivables, the company determines the expected cash flow for the
receivable and calculates an estimate of the potential loss and the
probability of loss. For those accounts in which the loss is probable,
the company records a specific reserve. In addition, the company
records an unallocated reserve that is determined by applying a
reserve rate to its different portfolios, excluding accounts that have
been specifically reserved. This reserve rate is based upon credit rating,
probability of default, term, characteristics (lease/loan) and loss history.
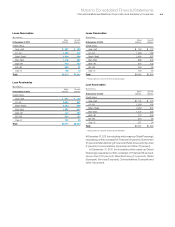
Financing Receivables on Non-Accrual Status
The following table presents the recorded investment in financing
receivables which are on non-accrual status.
($ in millions)
At December 31: 2011 2010
Major markets $ 46 $ 69
Growth markets 20 33
Total lease receivables $ 66 $101
Major markets $ 75 $141
Growth markets 24 123
Total loan receivables $ 99 $264
Total receivables $165 $366
Impaired Loans
The company considers any loan with an individually evaluated
reserve as an impaired loan. Depending on the level of impairment,
loans will also be placed on a non-accrual status. The following table
presents impaired client loan receivables.
($ in millions)
At December 31, 2011:
Recorded
Investment
Related
Allowance
Major markets $110 $ 70
Growth markets 62 53
To t a l $172 $123
($ in millions)
At December 31, 2010:
Recorded
Investment
Related
Allowance
Major markets $196 $119
Growth markets 132 68
To t a l $328 $187
($ in millions)
At December 31, 2011:
Average
Recorded
Investment
Interest
Income
Recognized
Interest
Income
Recognized
on Cash
Basis
Major markets $142 $2 $0
Growth markets 90 0 0
To t a l $232 $3 $0
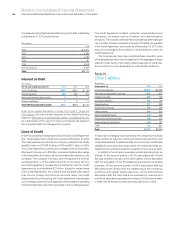
Credit Quality Indicators
The company’s credit quality indicators which are based on rating
agency data, publicly available information and information provided
by customers, are reviewed periodically based on the relative level
of risk. The resulting indicators are a numerical rating system that
maps to Moody’s Investors Service credit ratings as shown on the
following page. Moody’s does not provide credit ratings to the
company on its customers.
The tables present the gross recorded investment for each class
of receivables, by credit quality indicator. Receivables with a credit
quality indicator ranging from Aaa to Baa3 are considered investment
grade. All others are considered non-investment grade.