IBM 2011 Annual Report Download - page 47
Download and view the complete annual report
Please find page 47 of the 2011 IBM annual report below. You can navigate through the pages in the report by either clicking on the pages listed below, or by using the keyword search tool below to find specific information within the annual report.-
 1
1 -
2
-
3
-
4
-
5
-
6
-
7
-
8
-
9
-
10
-
11
-
12
-
13
-
14
-
15
-
16
-
17
-
18
-
19
-
20
-
21
-
22
-
23
-
24
-
25
-
26
-
27
-
28
-
29
-
30
-
31
-
32
-
33
-
34
-
35
-
36
-
 37
37 -
 38
38 -
 39
39 -
 40
40 -
 41
41 -
 42
42 -
 43
43 -
 44
44 -
 45
45 -
 46
46 -
 47
47 -
 48
48 -
 49
49 -
 50
50 -
 51
51 -
 52
52 -
 53
53 -
 54
54 -
 55
55 -
 56
56 -
 57
57 -
58
-
59
-
60
-
61
-
62
-
63
-
64
-
65
-
66
-
67
-
68
-
69
-
70
-
71
-
72
-
73
-
74
-
75
-
76
-
77
-
78
-
79
-
80
-
81
-
82
-
83
-
84
-
85
-
86
-
87
-
88
-
89
-
90
-
91
-
92
-
93
-
94
-
95
-
96
-
97
-
98
-
99
-
100
-
101
-
102
-
103
-
104
-
105
-
106
-
107
-
108
-
109
-
110
-
111
-
112
-
113
-
114
-
115
-
116
-
117
-
118
-
119
-
120
-
121
-
122
-
123
-
124
-
125
-
126
-
127
-
128
-
129
-
130
-
131
-
132
-
133
-
134
-
135
-
136
-
137
-
138
-
139
-
140
-
141
-
142
-
143
-
144
-
145
-
146
-
147
-
148
 |
 |

45
Management Discussion
International Business Machines Corporation and Subsidiary Companies
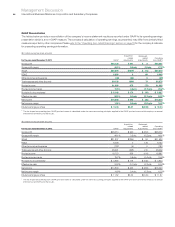
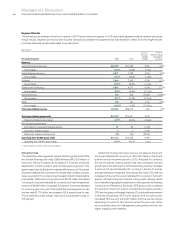
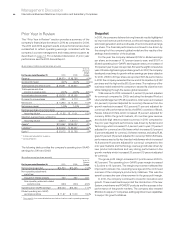
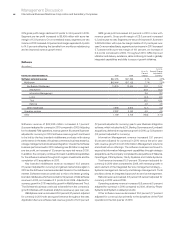
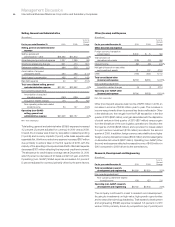
Total expense and other income increased 2.5 percent in 2010
versus 2009. Total operating (non-GAAP) expense and other income
increased 2.3 percent in 2010 versus 2009. The year-to-year drivers
for both categories were approximately:
• Base expense (2) points
• Currency* 1 point
• Acquisitions** 3 points
* Reflects impacts of translation and hedging programs.
** Includes acquisitions completed in prior 12-month period.
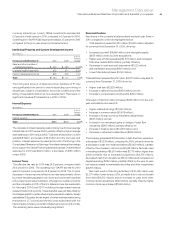
Pre-tax income grew 8.7 percent and the pre-tax margin was
19.7 percent, an increase of 0.8 points versus 2009. Net income
increased 10.5 percent reflecting an improvement in the tax rate.
The effective tax rate was 24.8 percent compared with 26.0 percent
in the prior year. Net income margin improved 0.8 points to 14.9 percent.
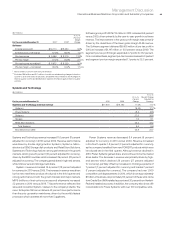
Operating (non-GAAP) pre-tax income increased 9.6 percent and
the operating (non-GAAP) pre-tax margin was 19.9 percent, an
increase of 1.0 points versus the prior year. Operating (non-GAAP)
earnings increased 11.7 percent and the operating (non-GAAP)
earnings margin of 15.0 percent increased 1.0 points versus the prior
year. The operating (non-GAAP) effective tax rate was 24.4 percent
versus 25.8 percent in 2009.
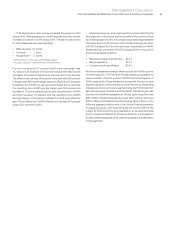
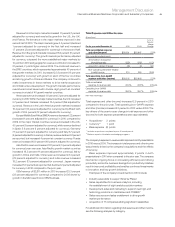
Diluted earnings per share improved 15.1 percent reflecting the
strong growth in net income and the benefits of the common stock
repurchase program. In 2010, the company repurchased approximately
118 million shares of its common stock. Diluted earnings per share
of $11.52 increased $1.51 from the prior year. Operating (non-GAAP)
diluted earnings per share of $11.67 increased $1.64 versus 2009
driven by the following factors:
• Revenue increase at actual rates $0.43
• Margin expansion $0.74
• Common stock repurchases $0.47
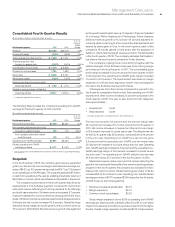
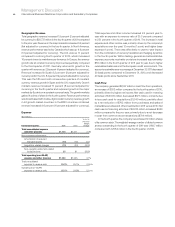
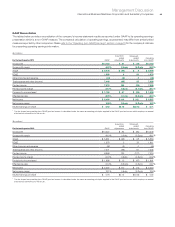
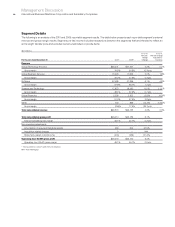
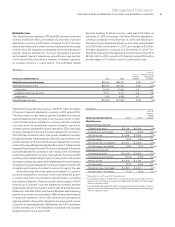
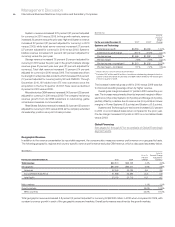
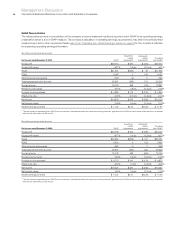
Workforce rebalancing charges were recorded in the first quarter
of 2009 and 2010. The PLM and Geodis divestiture transactions
were recorded in the first quarter of 2010 and the first quarter of
2009, respectively. These transactions impacted the year-to-year
segment results for 2010 compared to 2009. Workforce rebalancing
charges were incurred in every segment while the PLM transaction
gain was recorded in Software and the Geodis transaction gain was
recorded in the following segments: Global Technology Services
($81 million), Global Business Services ($46 million), Software
($106 million) and Systems and Technology ($64 million). In the
following segment analysis and in the Global Financing analysis
on pages 63 and 64, each segment’s pre-tax income and pre-tax
margin for 2010 and 2009 are presented on an as-reported basis
and on a basis normalized for these transactions in both years to
provide a better perspective of the underlying operational performance
of the segments.