IBM 2011 Annual Report Download - page 142
Download and view the complete annual report
Please find page 142 of the 2011 IBM annual report below. You can navigate through the pages in the report by either clicking on the pages listed below, or by using the keyword search tool below to find specific information within the annual report.-
 1
1 -
2
-
3
-
4
-
5
-
6
-
7
-
8
-
9
-
10
-
11
-
12
-
13
-
14
-
15
-
16
-
17
-
18
-
19
-
20
-
21
-
22
-
23
-
24
-
25
-
26
-
27
-
28
-
29
-
30
-
31
-
32
-
33
-
34
-
35
-
36
-
37
-
38
-
39
-
40
-
41
-
42
-
43
-
44
-
45
-
46
-
47
-
48
-
49
-
50
-
51
-
52
-
53
-
54
-
55
-
56
-
57
-
58
-
59
-
60
-
61
-
62
-
63
-
64
-
65
-
66
-
67
-
68
-
69
-
70
-
71
-
72
-
73
-
74
-
75
-
76
-
77
-
78
-
79
-
80
-
81
-
82
-
83
-
84
-
85
-
86
-
87
-
88
-
89
-
90
-
91
-
92
-
93
-
94
-
95
-
96
-
97
-
98
-
99
-
100
-
101
-
102
-
103
-
104
-
105
-
106
-
107
-
108
-
109
-
110
-
111
-
112
-
113
-
114
-
115
-
116
-
117
-
118
-
119
-
120
-
121
-
122
-
123
-
124
-
125
-
126
-
127
-
128
-
129
-
130
-
131
-
 132
132 -
 133
133 -
 134
134 -
 135
135 -
 136
136 -
 137
137 -
 138
138 -
 139
139 -
 140
140 -
 141
141 -
 142
142 -
 143
143 -
 144
144 -
 145
145 -
 146
146 -
 147
147 -
 148
148
 |
 |

140
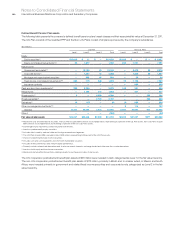
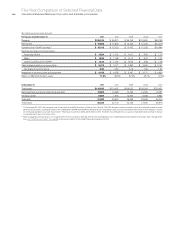
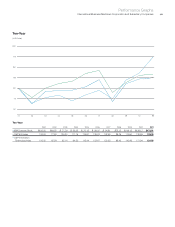
Five-Year Comparison of Selected Financial Data
International Business Machines Corporation and Subsidiary Companies
($ in millions except per share amounts)
For the year ended December 31: 2011 2010 2009 2008 2007
Revenue $106,916 $ 99,870 $ 95,758 $103,630 $98,786
Net income $ 15,855 $ 14,833 $ 13,425 $ 12,334 $10,418*
Operating (non-GAAP) earnings** $ 16,318 $ 15,023 $ 13,452 $ 12,293 $10,864
Earnings per share of common stock
Assuming dilution $ 13.06 $ 11.52 $ 10.01 $ 8.89 $ 7.15
Basic $ 13.25 $ 11.69 $ 10.12 $ 9.02 $ 7.27
Diluted operating (non-GAAP)** $ 13.44 $ 11.67 $ 10.03 $ 8.86 $ 7.46
Cash dividends paid on common stock $ 3,473 $ 3,177 $ 2,860 $ 2,585 $ 2,147
Per share of common stock 2.90 2.50 2.15 1.90 1.50
Investment in property, plant and equipment $ 4,108 $ 4,185 $ 3,447 $ 4,171 $ 4,630
Return on IBM stockholders’ equity 71.2% 66.8% 80.4% 48.7% 42.6%
At December 31: 2011 2010 2009 2008 2007
Total assets $116,433 $113,452 $109,022 $109,524 $120,431
Net investment in property, plant and equipment 13,883 14,096 14,165 14,305 15,081
Working capital 8,805 7,554 12,933 6,568 8,867
Total debt 31,320 28,624 26,099 33,926 35,274
Total equity 20,236 23,172 22,755 13,584 28,615
*
On December 31, 2002, the company sold its hard disk drive (HDD) business to Hitachi, Ltd. (Hitachi). The HDD business was accounted for as a discontinued operation under
generally accepted accounting principles in the United States (GAAP) and therefore, the HDD results of operations and cash flows have been removed from the company’s results
of continuing operations and cash flow for 2007. There was no activity in 2008, 2009, 2010 or 2011. The 2007 discontinued net loss was less than $0.5 millon and had no impact
on earnings per share of common stock.
** Refer to page 62 of the company’s first-quarter 2011 Form 10-Q filed on April 26, 2011 for the reconciliation of non-GAAP financial information for the years 2007 through 2010.
Also see “GAAP Reconciliation,” on page 38 for the reconciliation of non-GAAP financial information for 2011.