IBM 2011 Annual Report Download - page 42
Download and view the complete annual report
Please find page 42 of the 2011 IBM annual report below. You can navigate through the pages in the report by either clicking on the pages listed below, or by using the keyword search tool below to find specific information within the annual report.-
 1
1 -
2
-
3
-
4
-
5
-
6
-
7
-
8
-
9
-
10
-
11
-
12
-
13
-
14
-
15
-
16
-
17
-
18
-
19
-
20
-
21
-
22
-
23
-
24
-
25
-
26
-
27
-
28
-
29
-
30
-
31
-
 32
32 -
 33
33 -
 34
34 -
 35
35 -
 36
36 -
 37
37 -
 38
38 -
 39
39 -
 40
40 -
 41
41 -
 42
42 -
 43
43 -
 44
44 -
 45
45 -
 46
46 -
 47
47 -
 48
48 -
 49
49 -
 50
50 -
 51
51 -
 52
52 -
53
-
54
-
55
-
56
-
57
-
58
-
59
-
60
-
61
-
62
-
63
-
64
-
65
-
66
-
67
-
68
-
69
-
70
-
71
-
72
-
73
-
74
-
75
-
76
-
77
-
78
-
79
-
80
-
81
-
82
-
83
-
84
-
85
-
86
-
87
-
88
-
89
-
90
-
91
-
92
-
93
-
94
-
95
-
96
-
97
-
98
-
99
-
100
-
101
-
102
-
103
-
104
-
105
-
106
-
107
-
108
-
109
-
110
-
111
-
112
-
113
-
114
-
115
-
116
-
117
-
118
-
119
-
120
-
121
-
122
-
123
-
124
-
125
-
126
-
127
-
128
-
129
-
130
-
131
-
132
-
133
-
134
-
135
-
136
-
137
-
138
-
139
-
140
-
141
-
142
-
143
-
144
-
145
-
146
-
147
-
148
 |
 |

40
Management Discussion
International Business Machines Corporation and Subsidiary Companies
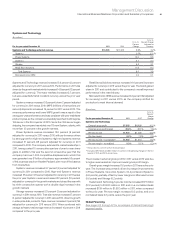
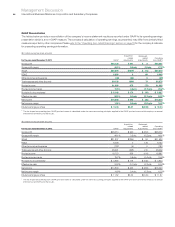
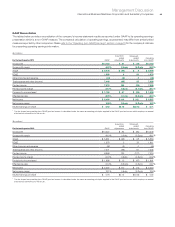
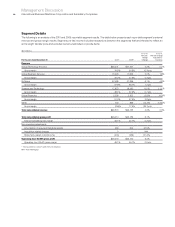
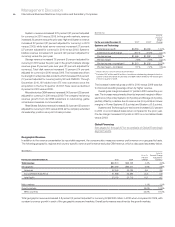
Segment Details
The following is an analysis of the fourth quarter of 2011 versus the fourth quarter of 2010 reportable segment external revenue and gross
margin results. Segment pre-tax income includes transactions between the segments that are intended to reflect an arm’s-length transfer
price and excludes certain unallocated corporate items.
($ in millions)
For the fourth quarter: 2011 2010*
Yr.-to-Yr.
Percent/
Margin
Change
Yr.-to-Yr.
Percent Change
Adjusted for
Currency
Revenue
Global Technology Services $10,452 $10,165 2.8%2.6%
Gross margin 36.6% 34.5% 2.1 pts.
Global Business Services 4,877 4,758 2.5%1.7%
Gross margin 29.3% 28.0% 1.3 pts.
Software 7,648 7,039 8.7%8.7%
Gross margin 89.8% 89.6% 0.2 pts.
Systems and Technology 5,803 6,277 (7.6)% (7.7)%
Gross margin 40.5% 43.6% (3.1) pts.
Global Financing 548 628 (12.9)% (12.6)%
Gross margin 49.7% 51.8% (2.1) pts.
Other 159 151 4.7%4.7%
Gross margin (11.0)% 10.3% (21.3) pts.
Total consolidated revenue $29,486 $29,019 1.6%1.4%
Total consolidated gross profit $14,722 $14,227 3.5%
Total consolidated gross margin 49.9% 49.0% 0.9 pts.
Non-operating adjustments
Amortization of acquired intangible assets 81 82 (1.2)%
Acquisition-related charges 00 0.0%
Retirement-related costs/(income) (10) (60)(82.9)%
Operating (non-GAAP) gross profit $14,793 $14,249 3.8%
Operating (non-GAAP) gross margin 50.2% 49.1% 1.1pts.
* Reclassified to conform with 2011 presentation.
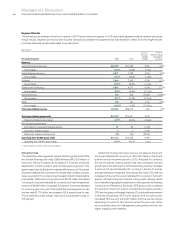
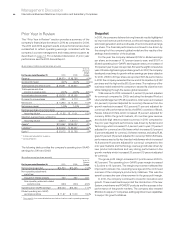
Global Services
The Global Services segments, Global Technology Services (GTS)
and Global Business Services (GBS) delivered $15,329 million of
revenue in the fourth quarter, an increase of 2.7 percent (2 percent
adjusted for currency) year to year. Overall revenue growth in the
quarter was driven by the growth markets with revenue up 11.4 percent
(13 percent adjusted for currency) with double-digit constant currency
revenue growth in the outsourcing, transactional and maintenance
businesses. Total outsourcing revenue of $7,210 million increased
3.6 percent (3 percent adjusted for currency) and total transactional
revenue of $6,246 million increased 2.9 percent (2 percent adjusted
for currency) year over year. Total Global Services segment pre-tax
income was $2,771 million, an increase of 16.9 percent year to year.
The combined pre-tax margin improved 2.1 points year to year to
17.5 percent.
Global Technology Services revenue increased 2.8 percent
(3 percent adjusted for currency) to $10,452 million in the fourth
quarter versus the same period in 2010. Adjusted for currency,
the fourth-quarter revenue growth rate was consistent with the
growth rate in the third quarter. GTS Outsourcing revenue increased
3.4 percent (3 percent adjusted for currency) in the fourth quarter
and gained share. Integrated Technology Services (ITS) revenue
increased 4.6 percent (4 percent adjusted for currency) in the fourth
quarter. ITS had strong performance in the growth markets, driven
by the benefits of geographic expansion in offerings such as Business
Continuity and Resiliency Services. GTS gross profit increased
9.0 percent in the fourth quarter compared to the same period in
2010 and the gross profit margin improved 2.1 points with improvement
in all lines of business. GTS fourth-quarter 2011 pre-tax income
increased 18.0 percent to $1,930 million with the pre-tax margin
expanding 2.3 points to 18.0 percent, versus the prior year, driven
by productivity and cost management, along with a mix into the
higher margin growth markets.