IBM 2011 Annual Report Download - page 126
Download and view the complete annual report
Please find page 126 of the 2011 IBM annual report below. You can navigate through the pages in the report by either clicking on the pages listed below, or by using the keyword search tool below to find specific information within the annual report.-
 1
1 -
2
-
3
-
4
-
5
-
6
-
7
-
8
-
9
-
10
-
11
-
12
-
13
-
14
-
15
-
16
-
17
-
18
-
19
-
20
-
21
-
22
-
23
-
24
-
25
-
26
-
27
-
28
-
29
-
30
-
31
-
32
-
33
-
34
-
35
-
36
-
37
-
38
-
39
-
40
-
41
-
42
-
43
-
44
-
45
-
46
-
47
-
48
-
49
-
50
-
51
-
52
-
53
-
54
-
55
-
56
-
57
-
58
-
59
-
60
-
61
-
62
-
63
-
64
-
65
-
66
-
67
-
68
-
69
-
70
-
71
-
72
-
73
-
74
-
75
-
76
-
77
-
78
-
79
-
80
-
81
-
82
-
83
-
84
-
85
-
86
-
87
-
88
-
89
-
90
-
91
-
92
-
93
-
94
-
95
-
96
-
97
-
98
-
99
-
100
-
101
-
102
-
103
-
104
-
105
-
106
-
107
-
108
-
109
-
110
-
111
-
112
-
113
-
114
-
115
-
 116
116 -
 117
117 -
 118
118 -
 119
119 -
 120
120 -
 121
121 -
 122
122 -
 123
123 -
 124
124 -
 125
125 -
 126
126 -
 127
127 -
 128
128 -
 129
129 -
 130
130 -
 131
131 -
 132
132 -
 133
133 -
 134
134 -
 135
135 -
 136
136 -
137
-
138
-
139
-
140
-
141
-
142
-
143
-
144
-
145
-
146
-
147
-
148
 |
 |

Notes to Consolidated Financial Statements
International Business Machines Corporation and Subsidiary Companies124
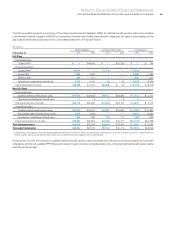
Defined Benefit Pension and Nonpension
Postretirement Benefit Plan Financial Information
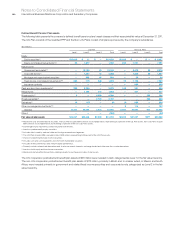
The following tables through page 126 represent financial information
for the company’s retirement-related benefit plans, excluding defined
contribution plans. The defined benefit pension plans under U.S.
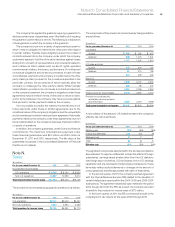
Plans consists of the Qualified PPP, the Excess PPP and the Retention
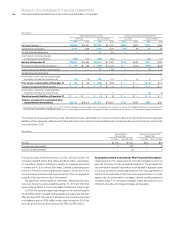
The tables below present the components of net periodic (income)/cost of the company’s retirement-related benefit plans recognized in
Consoli dated Statement of Earnings, excluding defined contribution plans.
($ in millions)
Defined Benefit Pension Plans
U.S. Plans Non-U.S. Plans
For the year ended December 31: 2011 2010 2009 2011 2010 2009
Service cost $ — $ — $ — $ 505 $ 508 $ 585
Interest cost 2,456 2,601 2,682 1,843 1,841 1,898
Expected return on plan assets (4,043) (4,017) (4,009) (2,521) (2,461) (2,534)
Amortization of transition assets —— — (0) (0) (0)
Amortization of prior service costs/(credits) 10 10 10 (162) (174) (126)
Recognized actuarial losses 818 471 411 957 712 624
Curtailments and settlements —1 — 127 (126)
Multi-employer plans/other costs —— — 111 89 200
Total net periodic (income)/cost $ (759) $ (935) $ (906) $ 734 $ 541 $ 521
($ in millions)
Nonpension Postretirement Benefit Plans
U.S. Plan Non-U.S. Plans
For the year ended December 31: 2011 2010 2009 2011 2010 2009
Service cost $ 33 $ 33 $ 41 $ 11 $ 9 $ 10
Interest cost 236 262 289 67 59 51
Expected return on plan assets —— — (10) (9) (8)
Amortization of transition assets —— — 00 0
Amortization of prior service costs/(credits) —(14) (39) (4) (5) (6)
Recognized actuarial losses —— — 13 12 11
Total net periodic cost $269 $281 $292 $ 76 $66 $ 58
Plan. The defined benefit pension plans and the nonpension
postretirement benefit plans under Non-U.S. Plans consists of all
plans sponsored by the company’s subsidiaries. The nonpension
postretirement benefit plan under U.S. Plan consists of only the U.S.
Non pension Postretirement Benefit Plan.