IBM 2011 Annual Report Download - page 44
Download and view the complete annual report
Please find page 44 of the 2011 IBM annual report below. You can navigate through the pages in the report by either clicking on the pages listed below, or by using the keyword search tool below to find specific information within the annual report.-
 1
1 -
2
-
3
-
4
-
5
-
6
-
7
-
8
-
9
-
10
-
11
-
12
-
13
-
14
-
15
-
16
-
17
-
18
-
19
-
20
-
21
-
22
-
23
-
24
-
25
-
26
-
27
-
28
-
29
-
30
-
31
-
32
-
33
-
 34
34 -
 35
35 -
 36
36 -
 37
37 -
 38
38 -
 39
39 -
 40
40 -
 41
41 -
 42
42 -
 43
43 -
 44
44 -
 45
45 -
 46
46 -
 47
47 -
 48
48 -
 49
49 -
 50
50 -
 51
51 -
 52
52 -
 53
53 -
 54
54 -
55
-
56
-
57
-
58
-
59
-
60
-
61
-
62
-
63
-
64
-
65
-
66
-
67
-
68
-
69
-
70
-
71
-
72
-
73
-
74
-
75
-
76
-
77
-
78
-
79
-
80
-
81
-
82
-
83
-
84
-
85
-
86
-
87
-
88
-
89
-
90
-
91
-
92
-
93
-
94
-
95
-
96
-
97
-
98
-
99
-
100
-
101
-
102
-
103
-
104
-
105
-
106
-
107
-
108
-
109
-
110
-
111
-
112
-
113
-
114
-
115
-
116
-
117
-
118
-
119
-
120
-
121
-
122
-
123
-
124
-
125
-
126
-
127
-
128
-
129
-
130
-
131
-
132
-
133
-
134
-
135
-
136
-
137
-
138
-
139
-
140
-
141
-
142
-
143
-
144
-
145
-
146
-
147
-
148
 |
 |

42
Management Discussion
International Business Machines Corporation and Subsidiary Companies
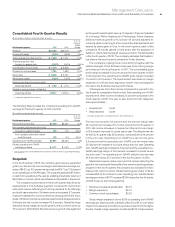
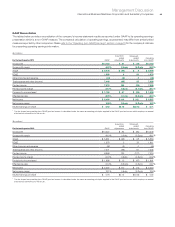
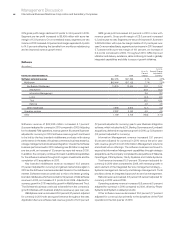
Geographic Revenue
Total geographic revenue increased 1.9 percent (2 percent adjusted
for currency) to $28,772 million in the fourth quarter of 2011 compared
to the prior year. Revenue in the major markets increased 0.5 percent
(flat adjusted for currency) in the fourth quarter. In North America,
revenue performance was led by Canada which was up 11.6 percent
(13 percent adjusted for currency). The U.S. was up 1.1 percent
compared to a strong fourth quarter of 2010, which increased
10 percent driven by mainframe performance. In Europe, the revenue
growth rate at constant currency improved sequentially compared
to the third quarter of 2011. Germany returned to growth in the
quarter with revenue up 2.9 percent (4 percent adjusted for currency).
Revenue increased in Spain 8.2 percent (9 percent adjusted for
currency) and in the U.K. 8.4 percent (9 percent adjusted for currency).
This was the fifth and ninth consecutive quarters of constant
currency revenue growth in Spain and the U.K, respectively. Growth
markets revenue increased 7.1 percent (8 percent adjusted for
currency) in the fourth quarter and outpaced growth in the major
markets by 8 points on a constant currency basis. The growth markets
gained 4 points of share in the fourth quarter. Revenue performance
was broad based with double-digit constant currency revenue growth
in 40 growth market countries. In the BRIC countries, combined
revenue increased 9.6 percent (11 percent adjusted for currency).
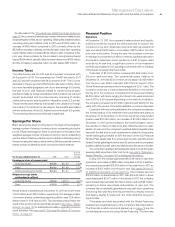
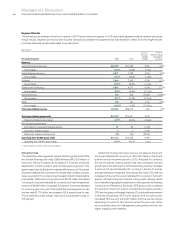
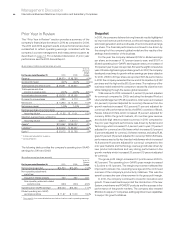
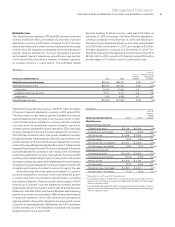
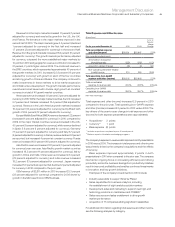
Expense
($ in millions)
For the fourth quarter: 2011 2010
Yr.-to-Yr.
Percent/
Margin
Change
Total consolidated expense
and other (income) $7,448 $7,271 2.4%
Non-operating adjustments
Amortization of acquired
intangible assets (72) (75) (4.2)
Acquisition-related charges (13) (23) (42.8)
Non-operating retirement-related
(costs)/income 25 61 (58.9)
Total operating (non-GAAP)
expense and other (income) $7,388 $7,235 2.1%
Total consolidated
expense-to-revenue ratio 25.3% 25.1%0.2 pts.
Operating (non-GAAP)
expense-to-revenue ratio 25.1% 24.9%0.1 pts.
Total expense and other income increased 2.4 percent year to
year with an expense-to-revenue-ratio of 25.3 percent compared
to 25.1 percent in the fourth quarter of 2010. The increase in total
expense and other income was primarily driven by the company’s
acquisitions over the past 12 months (1 point) and higher base
expense (1 point). There was effectively no year-to-year impact
from the combination of currency translation and hedging dynamics
in the fourth quarter. Within Selling, general and administrative
expense, accounts receivable provisions increased approximately
$55 million in the fourth quarter of 2011 year to year due to higher
receivables balances and the European credit environment. The
accounts receivable reserve coverage at December 31, 2011 decreased
30 basis points compared to December 31, 2010, and decreased
20 basis points since September 2011.
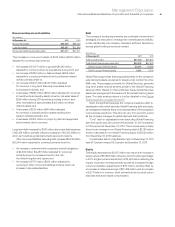
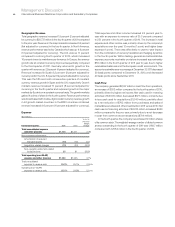
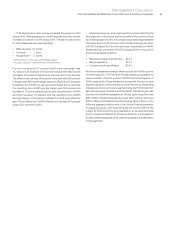
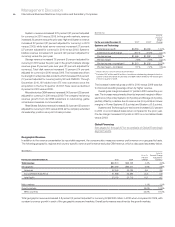
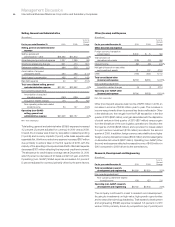
Cash Flow
The company generated $7,097 million in cash flow from operations,
an increase of $302 million compared to the fourth quarter of 2010,
primarily driven by higher net income. Net cash used in investing
activities of $3,505 million decreased $577 million, primarily due
to less cash used for acquisitions ($1,340 million), partially offset
by a net reduction of $762 million from purchases and sales of
marketable securities and other investments in 2011 versus 2010. Net
cash used in financing activities of $2,810 million increased $950
million compared to the prior year, primarily due to a net decrease
in cash from common stock transactions ($704 million).
In the fourth quarter, the company repurchased 19 million shares
of its common stock. The weighted-average number of diluted common
shares outstanding in the fourth quarter of 2011 was 1,188.7 million
compared with 1,258.4 million in the fourth quarter of 2010.