IBM 2011 Annual Report Download - page 56
Download and view the complete annual report
Please find page 56 of the 2011 IBM annual report below. You can navigate through the pages in the report by either clicking on the pages listed below, or by using the keyword search tool below to find specific information within the annual report.-
 1
1 -
2
-
3
-
4
-
5
-
6
-
7
-
8
-
9
-
10
-
11
-
12
-
13
-
14
-
15
-
16
-
17
-
18
-
19
-
20
-
21
-
22
-
23
-
24
-
25
-
26
-
27
-
28
-
29
-
30
-
31
-
32
-
33
-
34
-
35
-
36
-
37
-
38
-
39
-
40
-
41
-
42
-
43
-
44
-
45
-
 46
46 -
 47
47 -
 48
48 -
 49
49 -
 50
50 -
 51
51 -
 52
52 -
 53
53 -
 54
54 -
 55
55 -
 56
56 -
 57
57 -
 58
58 -
 59
59 -
 60
60 -
 61
61 -
 62
62 -
 63
63 -
 64
64 -
 65
65 -
 66
66 -
67
-
68
-
69
-
70
-
71
-
72
-
73
-
74
-
75
-
76
-
77
-
78
-
79
-
80
-
81
-
82
-
83
-
84
-
85
-
86
-
87
-
88
-
89
-
90
-
91
-
92
-
93
-
94
-
95
-
96
-
97
-
98
-
99
-
100
-
101
-
102
-
103
-
104
-
105
-
106
-
107
-
108
-
109
-
110
-
111
-
112
-
113
-
114
-
115
-
116
-
117
-
118
-
119
-
120
-
121
-
122
-
123
-
124
-
125
-
126
-
127
-
128
-
129
-
130
-
131
-
132
-
133
-
134
-
135
-
136
-
137
-
138
-
139
-
140
-
141
-
142
-
143
-
144
-
145
-
146
-
147
-
148
 |
 |

54
Management Discussion
International Business Machines Corporation and Subsidiary Companies
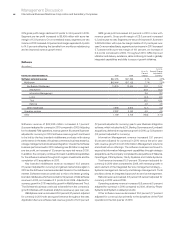
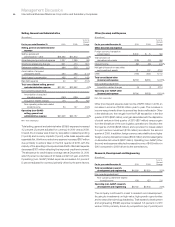
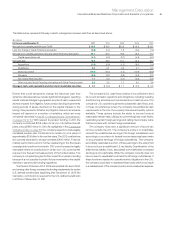
GAAP Reconciliation
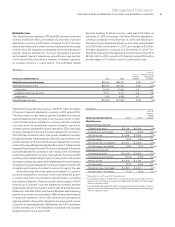
The tables below provide a reconciliation of the company’s income statement results as reported under GAAP to its operating earnings
presentation which is a non-GAAP measure. The company’s calculation of operating earnings, as presented, may differ from similarly titled
measures reported by other companies. Please refer to the “Operating (non-GAAP) Earnings” section on page 18 for the company’s rationale
for presenting operating earnings information.
($ in millions except per share amounts)
For the year ended December 31, 2010: GAAP
Acquisition-
related
Adjustments
Retirement-
related
Adjustments
Operating
(non-GAAP)
Gross profit $46,014 $ 260 $ (204)$46,070
Gross profit margin 46.1% 0.3 pts. (0.2) pts. 46.1%
SG&A $21,837 $(294) $ 84 $21,628
RD&E 6,026 0 126 6,152
Other (income) and expense (787) (4) 0 (791)
Total expense and other (income) 26,291 (298) 210 26,202
Pre-tax income 19,723 558 (414)19,867
Pre-tax income margin 19.7% 0.6 pts. (0.4) pts. 19.9%
Provision for income taxes* $ 4,890 $ 116 $ (162)$ 4,844
Effective tax rate 24.8% (0.1) pts. (0.3) pts. 24.4%
Net income $14,833 $ 443 $ (253)$15,023
Net income margin 14.9% 0.4 pts. (0.3) pts. 15.0%
Diluted earnings per share $ 11.52 $0.34 $(0.20)$ 11.67
* The tax impact on operating (non-GAAP) pre-tax income is calculated under the same accounting principles applied to the GAAP pre-tax income which employs an annual
effective tax rate method to the results.
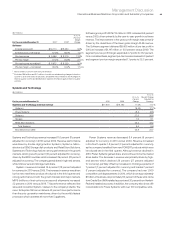
($ in millions except per share amounts)
For the year ended December 31, 2009: GAAP
Acquisition-
related
Adjustments
Retirement-
related
Adjustments
Operating
(non-GAAP)
Gross profit $43,785 $ 204 $ (259)$43,730
Gross profit margin 45.7% 0.2 pts. (0.3) pts. 45.7%
SG&A $20,952 $(293) $ 127 $20,787
RD&E 5,820 0 123 5,943
Other (income) and expense (351) (1) 0 (352)
Total expense and other (income) 25,647 (294) 250 25,603
Pre-tax income 18,138 498 (509)18,126
Pre-tax income margin 18.9% 0.5 pts. (0.5) pts. 18.9%
Provision for income taxes* $ 4,713 $ 141 $ (179)$ 4,675
Effective tax rate 26.0% 0.1pts. (0.3) pts. 25.8%
Net income $13,425 $ 357 $ (330)$13,452
Net income margin 14.0% 0.4 pts. (0.3) pts. 14.0%
Diluted earnings per share $ 10.01 $0.27 $(0.25)$ 10.03
* The tax impact on operating (non-GAAP) pre-tax income is calculated under the same accounting principles applied to the GAAP pre-tax income which employs an annual
effective tax rate method to the results.