IBM 2011 Annual Report Download - page 28
Download and view the complete annual report
Please find page 28 of the 2011 IBM annual report below. You can navigate through the pages in the report by either clicking on the pages listed below, or by using the keyword search tool below to find specific information within the annual report.-
 1
1 -
2
-
3
-
4
-
5
-
6
-
7
-
8
-
9
-
10
-
11
-
12
-
13
-
14
-
15
-
16
-
17
-
 18
18 -
 19
19 -
 20
20 -
 21
21 -
 22
22 -
 23
23 -
 24
24 -
 25
25 -
 26
26 -
 27
27 -
 28
28 -
 29
29 -
 30
30 -
 31
31 -
 32
32 -
 33
33 -
 34
34 -
 35
35 -
 36
36 -
 37
37 -
 38
38 -
39
-
40
-
41
-
42
-
43
-
44
-
45
-
46
-
47
-
48
-
49
-
50
-
51
-
52
-
53
-
54
-
55
-
56
-
57
-
58
-
59
-
60
-
61
-
62
-
63
-
64
-
65
-
66
-
67
-
68
-
69
-
70
-
71
-
72
-
73
-
74
-
75
-
76
-
77
-
78
-
79
-
80
-
81
-
82
-
83
-
84
-
85
-
86
-
87
-
88
-
89
-
90
-
91
-
92
-
93
-
94
-
95
-
96
-
97
-
98
-
99
-
100
-
101
-
102
-
103
-
104
-
105
-
106
-
107
-
108
-
109
-
110
-
111
-
112
-
113
-
114
-
115
-
116
-
117
-
118
-
119
-
120
-
121
-
122
-
123
-
124
-
125
-
126
-
127
-
128
-
129
-
130
-
131
-
132
-
133
-
134
-
135
-
136
-
137
-
138
-
139
-
140
-
141
-
142
-
143
-
144
-
145
-
146
-
147
-
148
 |
 |

26
Management Discussion
International Business Machines Corporation and Subsidiary Companies
Year in Review
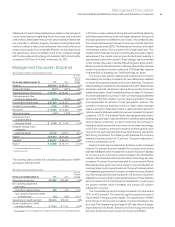
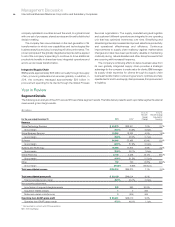
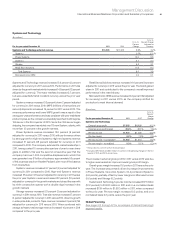
Segment Details
The following is an analysis of the 2011 versus 2010 reportable segment results. The table below presents each reportable segment’s external
revenue and gross margin results.
($ in millions)
For the year ended December 31: 2011 2010*
Yr.-to-Yr.
Percent/
Margin
Change
Yr.-to-Yr.
Percent Change
Adjusted for
Currency
Revenue
Global Technology Services $ 40,879 $38,201 7.0%2.7%
Gross margin 35.0% 34.5% 0.5 pts.
Global Business Services 19,284 18,223 5.8%1.5%
Gross margin 28.8% 28.0% 0.7 pts.
Software 24,944 22,485 10.9%8.0%
Gross margin 88.5% 87.9% 0.5 pts.
Systems and Technology 18,985 17,973 5.6%3.2%
Gross margin 39.8% 38.1% 1.6 pts.
Global Financing 2,102 2,238 (6.1)% (9.1)%
Gross margin 49.8% 51.3% (1.5 ) pts.
Other 722 750 (3.8)% (6.3)%
Gross margin (54.5)% (8.6)% (45.9) pts.
Total consolidated revenue $106,916 $99,870 7.1%3.4%
Total consolidated gross profit $ 50,138 $46,014 9.0%
Total consolidated gross margin 46.9% 46.1% 0.8 pts.
Non-operating adjustments
Amortization of acquired intangibles assets 340 260 30.8%
Acquisition-related charges 10NM
Retirement-related costs/(income) 2(204)NM
Operating (non-GAAP) gross profit $ 50,481 $46,070 9.6%
Operating (non-GAAP) gross margin 47.2% 46.1% 1.1 pts.
* Reclassified to conform with 2011 presentation.
NM—Not meaningful
company replicated in countries around the world, to a global model
with one set of processes, shared services and broadly distributed
decision making.
The company has now embarked on the next generation of its
transformation in which new capabilities and technologies like
business analytics and cloud computing will drive performance. The
proven principles of the globally integrated enterprise will be applied
to all of the company’s spending to continue to drive additional
productivity benefits in shared services, integrated operations and
end-to-end process transformation.
Integrated Supply Chain
IBM spends approximately $35 billion annually through its supply
chain, procuring materials and services globally. In addition, in
2011, the company managed approximately $20 billion in
procurement spending for its clients through the Global Process
Services organization. The supply, manufacturing and logistics
and customer fulfillment operations are integrated in one operating
unit that has optimized inventories over time. Simplifying and
streamlining internal processes has improved sales force productivity
and operational effectiveness and efficiency. Continuous
improvements to supply chain resiliency against market-place
changes and risks have been particularly valuable in maintaining
continuity during natural disasters and other disruptive events that
are occurring with increased frequency.
The company’s continuing efforts to derive business value from
its own globally integrated supply chain provides a strategic
advantage for the company to create value for clients. IBM leverages
its supply chain expertise for clients through its supply chain
business transformation outsourcing service to optimize and help
operate clients’ end-to-end supply chain processes, from procurement
to logistics.