IBM 2011 Annual Report Download
Download and view the complete annual report
Please find the complete 2011 IBM annual report below. You can navigate through the pages in the report by either clicking on the pages listed below, or by using the keyword search tool below to find specific information within the annual report.-
 1
1 -
 2
2 -
 3
3 -
 4
4 -
 5
5 -
 6
6 -
 7
7 -
 8
8 -
 9
9 -
 10
10 -
 11
11 -
 12
12 -
13
-
14
-
15
-
16
-
17
-
18
-
19
-
20
-
21
-
22
-
23
-
24
-
25
-
26
-
27
-
28
-
29
-
30
-
31
-
32
-
33
-
34
-
35
-
36
-
37
-
38
-
39
-
40
-
41
-
42
-
43
-
44
-
45
-
46
-
47
-
48
-
49
-
50
-
51
-
52
-
53
-
54
-
55
-
56
-
57
-
58
-
59
-
60
-
61
-
62
-
63
-
64
-
65
-
66
-
67
-
68
-
69
-
70
-
71
-
72
-
73
-
74
-
75
-
76
-
77
-
78
-
79
-
80
-
81
-
82
-
83
-
84
-
85
-
86
-
87
-
88
-
89
-
90
-
91
-
92
-
93
-
94
-
95
-
96
-
97
-
98
-
99
-
100
-
101
-
102
-
103
-
104
-
105
-
106
-
107
-
108
-
109
-
110
-
111
-
112
-
113
-
114
-
115
-
116
-
117
-
118
-
119
-
120
-
121
-
122
-
123
-
124
-
125
-
126
-
127
-
128
-
129
-
130
-
131
-
132
-
133
-
134
-
135
-
136
-
137
-
138
-
139
-
140
-
141
-
142
-
143
-
144
-
145
-
146
-
147
-
148
 |
 |

2011 Annual Report
Table of contents
-
Page 1
2011 Annual Report -
Page 2
-
Page 3
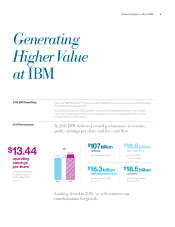
... profit in 2011 was from software, services and financing. Earnings per share: We have continued to achieve strong EPS growth. Last year was another record, with diluted operating earnings per share of $13.44, up 15 percent. This marked nine straight years of doubledigit EPS growth. Cash flow: IBM... -
Page 4
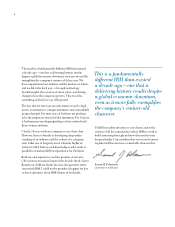
2 Virginia M. Rometty, President and CEO Samuel J. Palmisano, Chairman of the Board -
Page 5
... revenue in 2011, up from 11 percent in 2000, and we expect them to approach 30 percent by 2015. 2. Business Analytics. Our analytics business grew 16 percent for the year. Having spotted early the emergence of "big data," IBM built the world's leading analytics software and consulting practice... -
Page 6
... the company's ongoing operational performance. For information about the company's financial results related to (i ) operating pre-tax income, operating pre-tax income margin and operating earnings per share and (ii ) free cash flow, which are in each case non-GAAP measures, see the company's Form... -
Page 7
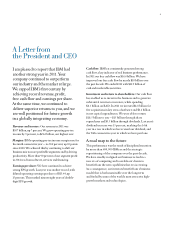
... about our business model, strategies, finances and governance principles. We would manage and grow IBM through the basics - revenue, profit, earnings, cash and margins. And we pledged to deliver consistent investor returns through dividends and repurchased shares. At the same time, we believed... -
Page 8
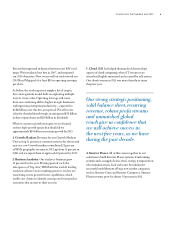
... can truly be a global citizen. Third, why would society allow us to operate? Over the past decade, we have increasingly sought to address the world's biggest problems, driven by the idea of building a smarter planet. Without question, we do this in pursuit of large new profit opportunities. But it... -
Page 9
... engineering, finance, marketing, management and more to help cities actually become smarter; to reimagine existing school models, as with P-TECH in New York City; and to develop global citizens and leaders, as we're doing through Corporate Service Corps. One consequence of this business-citizenship... -
Page 10
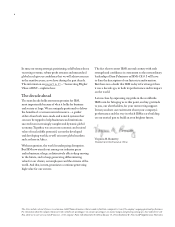
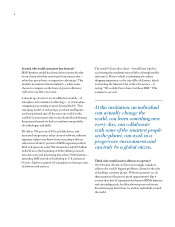
... - one that is delivering historic results despite a global economic downturn, even as it more fully exemplifies the company's century-old character. To IBM's steadfast investors, to our clients, and to the citizens of all the communities where IBMers work to build a smarter planet, please know that... -
Page 11
Generating Higher Value at IBM 9 Generating Higher V alue at IBM 2015 IBM Road Map Each year IBM describes how the company manages its business and serves its shareholders in a detailed ï¬nancial road map. A long-term perspective ensures IBM is well positioned to take advantage of major shifts ... -
Page 12
... our 19th consecutive year in 2011. Our strong business model performance has resulted in consistently strong free cash ï¬,ow generation. In 2011 our free cash ï¬,ow was $16.6 billion-an increase of nearly $10 billion since 2000. Growth Markets Share of Geographic Revenue % 1 % 2011 2010 2009... -
Page 13
... strong cash generation to return value to shareholders by reducing shares outstanding. At Least $20 Operating EPS* $13.44 $11.67 Operating (non-GAAP) EPS* Segment Pre-tax Income*, ** Software Services Hardware/Financing * Excludes acquisition-related and nonoperating retirement-related charges... -
Page 14
... 2011. 2011 Performance 2015 Road Map Objective: Growth Markets 22% of IBM's geographic revenue Business Analytics 16% revenue increase from 2010 Growth initiatives will contribute about $ 20 billion in incremental revenue growth Cloud 3.8 times 2010 revenue Smarter Planet Nearly 50% revenue... -
Page 15
... of care and reduce costs. analytics and optimization consultants 9,000 Cloud 2011 Results: 3.8x $ 2010 revenue IBM analyzes more than Cloud, which delivers business and IT services over the network, is transforming the way data centers are designed and software is developed, providing far... -
Page 16
...% revenue growth from 2010 More than Smarter Law Enforcement Memphis Police Department 2,000 Smarter Cities engagements 30% 15% decrease in serious crime Inside the solution: The system relies on IBM predictive analytics software that correlates historic data with the latest incident reports to... -
Page 17
... uses IBM data management, analytics and transaction processing software running on IBM Power systems. improved their mobility through exercises As part of a pilot to extend healthcare services without increasing costs, elderly citizens in Bolzano, Italy, were given access to advice and medical... -
Page 18
...19,549 3,984 15,375 3,177 2.50 2010 Cash, cash equivalents and marketable securities Total assets Working capital Total debt Total equity Common shares outstanding (in millions) Market capitalization Stock price per common share Number of employees in IBM/wholly owned subsidiaries * See page 38 for... -
Page 19
... Report of Independent Registered Public Accounting Firm Consolidated Financial Statements Earnings Comprehensive Income Financial Position Cash Flows Changes in Equity 70 71 72 73 74 Five-Year Comparison of Selected Financial Data Selected Quarterly Data Performance Graphs Board of Directors... -
Page 20
... Machines Corporation and Subsidiary Companies Overview The financial section of the International Business Machines Corporation (IBM or the company) 2011 Annual Report includes the Management Discussion, the Consolidated Financial Statements and the Notes to the Consolidated Financial Statements... -
Page 21
...record levels of revenue, profit, free cash flow and earnings per share (EPS). The financial performance is the result of the transformation of the company which began years ago. This transformation has been focused on shifting the business to higher value areas of the market, improving productivity... -
Page 22
...equivalents at year end was $11,922 million. Key drivers in the balance sheet and total cash flows are highlighted below. Total assets increased $2,981 million ($4,636 million adjusted for currency) from December 31, 2010 driven by: • Description of Business Please refer to IBM's Annual Report on... -
Page 23
...value illustrate IBM's deep commitment to building a smarter planet: Smarter Commerce and Smarter Cities. IBM's Smarter Commerce model integrates and transforms how companies manage and adapt their buy, market, sell and service processes, placing the customer squarely at the center of their business... -
Page 24
... improved overall productivity and is driving investment and expanding participation in the world's fastest growing markets. This business model, supported by the company's financial model, has enabled the company to deliver strong earnings, cash flows and returns to shareholders over the long term. -
Page 25
...: software that manages the fundamental processes that make computers run. GBS Capabilities Consulting and Systems Integration: delivery of value to clients through consulting services for Strategy and Transformation; Application Innovation Services; Enterprise Applications and Business Analytics... -
Page 26
... end users and internal clients for terms generally between one and seven years. Internal financing is predominantly in support of Global Services' long-term client service contracts. Global Financing also factors a selected portion of the company's accounts receivable, primarily for cash management... -
Page 27
Management Discussion International Business Machines Corporation and Subsidiary Companies 25 IBM Worldwide Organizations The following worldwide organizations play key roles in IBM's delivery of value to its clients: Sales and Distribution Research, Development and Intellectual Property ... -
Page 28
... For the year ended December 31: 2011 2010* Revenue Global Technology Services Gross margin Global Business Services Gross margin Software Gross margin Systems and Technology Gross margin Global Financing Gross margin Other Gross margin Total consolidated revenue Total consolidated gross pro... -
Page 29
... each reportable segment's pre-tax income as a percentage of total segment pre-tax income. Revenue For the year ended December 31: 2011 2010 Pre-tax Income*+ 2011 2010 Global Technology Services Global Business Services Total Global Services Software Systems and Technology Global Financing Total... -
Page 30
... versus 2010. On a normalized basis, total Global Services pre-tax income in 2011 increased 11.9 percent with a pre-tax margin of 15.2 percent, up 0.8 points year to year. In 2011, the company established two Global Services integration hubs which will drive the business to a new level of global... -
Page 31
... International Business Machines Corporation and Subsidiary Companies 29 ($ in billions) Yr.-to-Yr. Change Adjusted for Currency At December 31: 2011 2010 Yr.-to-Yr. Change Backlog Total backlog Outsourcing backlog $140.6 92.5 $142.4 96.5 $(1.7) (4.0) $ 0.0 (2.8) Total Global Services backlog... -
Page 32
.... The company's business analytics software offerings, most of which are part of Information Management, continue to outpace the market with double-digit revenue growth, year to year in 2011. Lotus revenue increased 3.8 percent (flat adjusted for currency) in 2011 compared to 2010, with growth... -
Page 33
...retail industry. Microelectronics OEM revenue increased 0.2 percent (flat adjusted for currency) in 2011 versus 2010, as the company shifted its production to meet internal demand. ($ in millions) Yr.-to-Yr. Percent/ Margin Change For the year ended December 31: 2011 2010* Systems and Technology... -
Page 34
...by the Microelectronics OEM business. Total Expense and Other Income ($ in millions) Yr.-to-Yr. Percent/ Margin Change For the year ended December 31: 2011 2010 Total consolidated expense and other (income) Non-operating adjustments Amortization of acquired intangible assets Acquisition-related... -
Page 35
... year ended December 31: 2011 2010 Selling, general and administrative expense Selling, general and administrative-other Advertising and promotional expense Workforce rebalancing charges Retirement-related costs Amortization of acquired intangibles assets Stock-based compensation Bad debt expense... -
Page 36
... an increased expected return on plan assets of $87 million. The increase in interest expense in 2011 versus 2010 was primarily driven by higher average debt levels, partially offset by lower average interest rates. Interest expense is presented in cost of financing in the Consolidated Statement of... -
Page 37
..., 2010 as the increase in the benefit obligation due to the reduction in discount rates more than offset the returns on plan assets. At year end, the company's qualified defined benefit plans were well funded and its cash requirements related to these plans remain stable going-forward. In 2011, the... -
Page 38
...to retirement-related plans of $196 million, primarily driven by lower non-U.S. employer funding in 2011; and - A decrease in cash used for workforce rebalancing activities of $278 million during 2011 compared to 2010. • An increase in short-term debt of $1,685 million primarily driven by: - New... -
Page 39
... in non-Global Financing equity of $2,929 million from December 31, 2010 balances. Consolidated debt-to-capitalization ratio at December 31, 2011 was 60.7 percent versus 55.3 percent at December 31, 2010. Equity Total equity decreased by $2,937 million as a result of an increase in treasury stock of... -
Page 40
...year ended December 31, 2011: GAAP Gross proï¬t Gross proï¬t margin SG&A RD&E Other (income) and expense Total expense and other (income) Pre-tax income Pre-tax income margin Provision for income taxes* Effective tax rate Net income Net income margin Diluted earnings per share effective tax rate... -
Page 41
... by strong growth in the focus areas of Smarter Commerce, business analytics and storage solutions. Software pre-tax income increased 12.5 percent. Global Services delivered strong margin and profit growth, with pre-tax income up 16.9 percent. Total Global Services revenue growth was again led Pre... -
Page 42
... transfer price and excludes certain unallocated corporate items. ($ in millions) Yr.-to-Yr. Percent/ Margin Change Yr.-to-Yr. Percent Change Adjusted for Currency For the fourth quarter: 2011 2010* Revenue Global Technology Services Gross margin Global Business Services Gross margin Software... -
Page 43
Management Discussion International Business Machines Corporation and Subsidiary Companies 41 Global Business Services revenue increased 2.5 percent (2 percent adjusted for currency) to $4,877 million in the fourth quarter of 2011. Application Outsourcing revenue increased 4.7 percent (4 percent ... -
Page 44
...of $762 million from purchases and sales of marketable securities and other investments in 2011 versus 2010. Net cash used in financing activities of $2,810 million increased $950 million compared to the prior year, primarily due to a net decrease in cash from common stock transactions ($704 million... -
Page 45
... quarter 2011: GAAP Gross proï¬t Gross proï¬t margin SG&A RD&E Other (income) and expense Total expense and other (income) Pre-tax income Pre-tax income margin Provision for income taxes* Effective tax rate Net income Net income margin Diluted earnings per share effective tax rate method to... -
Page 46
... 25,647 2.5% business model enabled the company to exceed its objective even Total expense and other while managing through the severe global recession. income-to-revenue ratio 26.3% 26.8% (0.5) pts. Total revenue for 2010 increased 4.3 percent (3 percent adjusted Income before income taxes $ 19,723... -
Page 47
Management Discussion International Business Machines Corporation and Subsidiary Companies 45 Total expense and other income increased 2.5 percent in 2010 versus 2009. Total operating (non-GAAP) expense and other income increased 2.3 percent in 2010 versus 2009. The year-to-year drivers for both ... -
Page 48
... For the year ended December 31: 2010* 2009* Revenue Global Technology Services Gross margin Global Business Services Gross margin Software Gross margin Systems and Technology Gross margin Global Financing Gross margin Other Gross margin Total consolidated revenue Total consolidated gross pro... -
Page 49
...of 0.8 percent versus 2009 with a pre-tax margin of 13.7 percent, down 0.2 points year to year. For the year ended December 31: 2010 2009 Yr.-to-Yr. Percent Change Yr.-to-Yr. Percent Change Adjusted for Currency Global Services external revenue Global Technology Services Outsourcing Integrated... -
Page 50
... middleware products with strong performance in the areas of business commerce, business analytics, storage management and business integration. Overall, the Software business performed well in 2010, delivering over $9 billion in segment pre-tax profit, an increase of 12 percent as reported versus... -
Page 51
Management Discussion International Business Machines Corporation and Subsidiary Companies 49 ($ in millions) For the year ended December 31: 2010* 2009* Yr.-to-Yr. Percent/ Margin Change Software External gross proï¬t External gross proï¬t margin Pre-tax income Pre-tax margin Pre-tax income... -
Page 52
... compared to the prior year. Pre-tax margin increased 0.8 points in 2010 on a normalized basis versus 2009. Global Financing See pages 63 through 67 for an analysis of Global Financing's segment results. Geographic Revenue In addition to the revenue presentation by reportable segment, the company... -
Page 53
...of the company's investments in 2010 include: Industry sales skills to support Smarter Planet Sales capabilities for business analytics, including the establishment of eight analytics solution centers Development, sales and marketing to support new high-end technology solutions in mainframes and... -
Page 54
... year ended December 31: 2010 2009 Selling, general and administrative expense Selling, general and administrative-other Advertising and promotional expense Workforce rebalancing charges Retirement-related costs Amortization of acquired intangibles assets Stock-based compensation Bad debt expense... -
Page 55
... sheet and total cash flows in 2010 compared to 2009 are highlighted below. Total assets increased $4,430 million ($3,609 million adjusted for currency) from December 31, 2009, driven by: For the year ended December 31: 2010 2009 Sales and other transfers of intellectual property Licensing... -
Page 56
...year ended December 31, 2010: GAAP Gross proï¬t Gross proï¬t margin SG&A RD&E Other (income) and expense Total expense and other (income) Pre-tax income Pre-tax income margin Provision for income taxes* Effective tax rate Net income Net income margin Diluted earnings per share effective tax rate... -
Page 57
... road map period. Overall, the company expects fairly balanced contribution from revenue growth, margin expansion and share repurchase. Looking forward, the company expects continued opportunity in the growth markets and in the higher value solutions, including business analytics, Smarter Planet and... -
Page 58
..., a key objective of the Global Financing business is to generate strong returns on equity. Increasing receivables is the basis for growth in a financing business. Accordingly, management considers Global Financing receivables as a profit-generating investment, not as working capital that should be... -
Page 59
... Global Financing receivables Capital expenditures, net Free cash ï¬,ow Acquisitions Divestitures Share repurchase Dividends Non-Global Financing debt Other (includes Global Financing receivables and Global Financing debt) Change in cash, cash equivalents and short-term marketable securities... -
Page 60
Management Discussion 58 International Business Machines Corporation and Subsidiary Companies Contractual Obligations ($ in millions) Total Contractual Payment Stream Payments Due In 2012 2013-14 2015-16 After 2016 Long-term debt obligations Interest on long-term debt obligations Capital (ï¬... -
Page 61
...'s defined benefit pension plans, the measurement of the benefit obligation to employees and net periodic pension (cost/income) requires the use of certain assumptions, including, among others, estimates of discount rates and expected return on plan assets. Changes in the discount rate assumptions... -
Page 62
... quarter of 2011, the company early adopted new Financial Accounting Standards Board guidance that simplifies how an entity tests goodwill for impairment. It provides an option to first assess qualitative factors to determine whether it is more likely than not that the fair value of a reporting unit... -
Page 63
...end of the lease. Residual value estimates impact the determination of whether a lease is classified as operating or capital. Global Financing estimates the future fair value of leased equipment by using historical models, analyzing the current market for new and used equipment and obtaining forward... -
Page 64
... have on the fair values of the company's debt and other financial instruments. The financial instruments that are included in the sensitivity analysis comprise all of the company's cash and cash equivalents, marketable securities, short-term and long-term loans, commercial financing and installment... -
Page 65
... 67 for the details of the after-tax income and return on equity calculation. Total revenue in 2011 increased $115 million versus 2010 as a result of: • • An increase in internal revenue of 13.6 percent primarily driven by an increase in used equipment sales revenue (up 19.7 percent to $1,528... -
Page 66
...Business Machines Corporation and Subsidiary Companies Total revenue in 2010 increased $4 million versus 2009 as a result of: • Financial Condition Balance Sheet ($ in millions) At December 31: 2011 2010 • An increase in internal revenue of 3.8 percent driven by an increase in used equipment... -
Page 67
... net increase in total financing assets from December 31, 2010. The increase in originations in both 2011 versus 2010 and 2010 versus 2009 was due to improving external volumes in both client and commercial financing. Internal loan financing with Global Services is executed under a loan facility and... -
Page 68
... effect of prioryear asset values being recognized as operating lease revenue in the current year. The associated aggregate guaranteed future values at the scheduled end of lease was $43 million for the financing transactions originated during 2011 and 2010, respectively. The cost of guarantees was... -
Page 69
... loans and leases at arm's-length pricing in support of Global Services' long-term contracts and other internal activity. The company believes these assets should be appropriately leveraged in line with the overall Global Financing business model. ($ in millions) December 31, 2011 December 31, 2010... -
Page 70
Report of Management 68 International Business Machines Corporation and Subsidiary Companies Management Responsibility for Financial Information Responsibility for the integrity and objectivity of the financial information presented in this Annual Report rests with IBM management. The accompanying... -
Page 71
Report of Independent Registered Public Accounting Firm International Business Machines Corporation and Subsidiary Companies 69 To the Stockholders and Board of Directors of International Business Machines Corporation: In our opinion, the accompanying Consolidated Financial Statements appearing on ... -
Page 72
...Statement of Earnings 70 International Business Machines Corporation and Subsidiary Companies ($ in millions except per share amounts) For the year ended December 31: Notes 2011 2010 2009 Revenue Services Sales Financing Total revenue Cost Services Sales Financing Total cost Gross proï¬t Expense... -
Page 73
... Statement of Comprehensive Income International Business Machines Corporation and Subsidiary Companies 71 ($ in millions) For the year ended December 31: Notes 2011 2010 2009 Net income Other comprehensive income/(loss), before tax: Foreign currency translation adjustments Net changes related... -
Page 74
Consolidated Statement of Financial Position 72 International Business Machines Corporation and Subsidiary Companies ($ in millions except per share amounts) At December 31: Notes 2011 2010 Assets Current assets Cash and cash equivalents Marketable securities Notes and accounts receivable-trade (... -
Page 75
...) Retirement related Inventories Other assets/other liabilities Accounts payable Net cash provided by operating activities Cash ï¬,ows from investing activities Payments for property, plant and equipment Proceeds from disposition of property, plant and equipment Investment in software Purchases of... -
Page 76
Consolidated Statement of Changes in Equity 74 International Business Machines Corporation and Subsidiary Companies ($ in millions) Common Stock and Additional Paid-In Capital Accumulated Other Treasury Comprehensive Stock Income/(Loss) Total IBM Stockholders' Equity NonControlling Interests ... -
Page 77
Consolidated Statement of Changes in Equity International Business Machines Corporation and Subsidiary Companies 75 ($ in millions) Common Stock and Additional Paid-In Capital Accumulated Other Treasury Comprehensive Stock Income/(Loss) Total IBM Stockholders' Equity NonControlling Interests ... -
Page 78
...page 85 within "Marketable Securities." Equity investments in non-publicly traded entities are primarily accounted for using the cost method. All intercompany transactions and accounts have been eliminated in consolidation. Use of Estimates The preparation of financial statements in conformity with... -
Page 79
... services, hardware and/or software. Services The company's primary services offerings include information technology (IT) datacenter and business process outsourcing, application management services, consulting and systems integration, technology infrastructure and system maintenance, Web hosting... -
Page 80
... Financing income attributable to sales-type leases, direct financing leases and loans is recognized on the accrual basis using the effective interest method. Operating lease income is recognized on a straight-line basis over the term of the lease. Best Estimate of Selling Price In certain limited... -
Page 81
... internal-use software programs, including software coding, installation, testing and certain data conversions. These capitalized costs are amortized on a straightline basis over periods up to two years and are recorded in selling, general and administrative expense. See note I, "Intangible Assets... -
Page 82
... in the Consolidated Statement of Financial Position, are presented in the following tables: Standard Warranty Liability ($ in millions) 2011 2010 Advertising and Promotional Expense The company expenses advertising and promotional costs when incurred. Cooperative advertising reimbursements from... -
Page 83
...The funded status of the company's defined benefit pension plans and nonpension postretirement benefit plans (retirement-related benefit plans) is recognized in the Consolidated Statement of Financial Position. The funded status is measured as the difference between the fair value of plan assets and... -
Page 84
... Financial Statements 82 International Business Machines Corporation and Subsidiary Companies Net periodic pension and nonpension postretirement benefit cost/(income) is recorded in the Consolidated Statement of Earnings and includes service cost, interest cost, expected return on plan assets... -
Page 85
... States (U.S.) dollars at year-end exchange rates. Translation adjustments are recorded in other comprehensive income. Income and expense items are translated at weighted-average rates of exchange prevailing during the year. Inventories, property, plant and equipment-net and other nonmonetary assets... -
Page 86
... Consolidated Statement of Cash Flows. When available, the company uses unadjusted quoted market prices to measure the fair value and classifies such items within Level 1. If quoted market prices are not available, fair value is based upon internally developed models that use current market-based... -
Page 87
... the remaining term of the debt security as projected using the company's cash flow projections. Inventories Raw materials, work in process and finished goods are stated at the lower of average cost or market. Cash flows related to the sale of inventories are reflected in net cash from operating... -
Page 88
...-employer pension plans. The purpose of the new disclosures is to provide financial statement users with information about an employer's level of participation in these plans and the financial health of significant plans. The new disclosures are effective for the full year 2011 financial statements... -
Page 89
... of assets or liabilities within a line item in the statement of financial position. In addition, significant transfers between Levels 1 and 2 of the fair value hierarchy are required to be disclosed. These additional requirements became effective January 1, 2010 for quarterly and annual reporting... -
Page 90
... for the year ended December 31, 2009. There was no material impact in the Consolidated Financial Statements. In May 2009, the FASB issued guidelines on subsequent event accounting which sets forth: 1) the period after the balance sheet date during which management of a reporting entity should... -
Page 91
... programs for smarter cities. Purchase price consideration for all acquisitions as reflected in the table above, is paid primarily in cash. All acquisitions are reported in the Consolidated Statement of Cash Flows net of acquired cash and cash equivalents. The overall weighted-average life of the... -
Page 92
... of cloud and on-premise analytics software that brings more intelligence to procurement and supply chain operations with spend, supplier and contract management for Smarter Commerce. At the date of issuance of the financial statements, the initial purchase accounting was not completed for the... -
Page 93
... Statements International Business Machines Corporation and Subsidiary Companies 91 The table below reflects the purchase price related to the 2010 acquisitions and the resulting purchase price allocations as of December 31, 2010. 2010 Acquisitions ($ in millions) Amortization Life (in Years... -
Page 94
Notes to Consolidated Financial Statements 92 International Business Machines Corporation and Subsidiary Companies 2009 Acquisitions ($ in millions) Amortization Life (in Years) SPSS Other Acquisitions Current assets Fixed assets/noncurrent assets Intangible assets Goodwill Completed technology ... -
Page 95
... at fair value on a recurring basis at December 31, 2011 and 2010. ($ in millions) At December 31, 2011: Level 1 Level 2 Level 3 Total Assets Cash equivalents (1) Time deposits and certiï¬cates of deposit Commercial paper Money market funds U.S. government securities Other securities Total Debt... -
Page 96
Notes to Consolidated Financial Statements 94 International Business Machines Corporation and Subsidiary Companies ($ in millions) At December 31, 2010: Level 1 Level 2 Level 3 Total Assets Cash equivalents (1) Time deposits and certiï¬cates of deposit Commercial paper Money market funds Canada ... -
Page 97
..., 2011 and 2010, respectively. Debt and Marketable Equity Securities The company's cash equivalents and current debt securities are considered available-for-sale and recorded at fair value which is not materially different from carrying value in the Consolidated Statement of Financial Position. The... -
Page 98
...'s lease and other financial assets and the interest rates associated with its financing debt. Derivatives are also used to manage the related cost of debt. For foreign currency exposures, derivatives are used to better manage the cash flow volatility arising from foreign exchange rate fluctuations... -
Page 99
Notes to Consolidated Financial Statements International Business Machines Corporation and Subsidiary Companies 97 The company may employ derivative instruments to hedge the volatility in stockholders' equity resulting from changes in currency exchange rates of significant foreign subsidiaries of ... -
Page 100
... have terms of one year or less. The swaps are recorded at fair value with gains and losses reported in other (income) and expense in the Consolidated Statement of Earnings. The company did not have any derivative instruments relating to this program outstanding at December 31, 2011 and 2010. -
Page 101
...Consolidated Statement of Financial Position ($ in millions) Fair Value of Derivative Assets Balance Sheet Classiï¬cation Fair Value of Derivative Liabilities Balance Sheet Classiï¬cation At December 31: 2011 2010 2011 2010 Designated as hedging instruments Prepaid expenses and other current... -
Page 102
... the year ended December 31: 2011 2010 2009 Effective Portion Reclassiï¬ed from AOCI 2010 2009 Derivative instruments in cash ï¬,ow hedges Interest rate contracts Foreign exchange contracts $ - (266) $ - 371 $ (0) Interest expense Other (income) and expense Cost of sales SG&A expense $ (8) (247... -
Page 103
..., 2011 and 2010, respectively, are loans that are provided primarily to clients to finance hardware, software and services ranging generally from one to three years. At December 31, 2011: Major Markets Growth Markets Total Financing receivables Lease receivables Loan receivables Ending balance... -
Page 104
... of default, term, characteristics (lease/loan) and loss history. ($ in millions) Interest Income Recognized on Cash Basis At December 31, 2011: Average Recorded Investment Interest Income Recognized Major markets Growth markets Total $142 90 $232 $2 0 $3 $0 0 $0 Financing Receivables on... -
Page 105
... to Consolidated Financial Statements International Business Machines Corporation and Subsidiary Companies 103 Lease Receivables ($ in millions) At December 31, 2011: Major Markets Growth Markets Lease Receivables* ($ in millions) At December 31, 2010: Major Markets Growth Markets Credit rating... -
Page 106
... Consolidated Financial Statements 104 International Business Machines Corporation and Subsidiary Companies Past Due Financing Receivables ($ in millions) Total Past Due > 90 Days* Total Financing Receivables Recorded Investment > 90 Days and Accruing At December 31, 2011: Current Major markets... -
Page 107
... for each of the five succeeding years relating to intangible assets currently recorded in the Consolidated Statement of Financial Position is estimated to be the following at December 31, 2011: ($ in millions) Capitalized Software Acquired Intangibles Total 2012 ($ in millions) Gross Carrying... -
Page 108
Notes to Consolidated Financial Statements 106 International Business Machines Corporation and Subsidiary Companies Goodwill The changes in the goodwill balances by reportable segment, for the years ended December 31, 2011 and 2010, are as follows: ($ in millions) Foreign Currency Translation and ... -
Page 109
... Swiss francs (3.8%) Other (5.1%) Less: net unamortized discount Add: fair value adjustment** Less: current maturities Total Debt securities issued by IBM International Group Capital LLC are fully and unconditionally guaranteed by the company. 2012 - 2013 2014 - 2015 2016 -2020 2021 2025 2027 2028... -
Page 110
... to Consolidated Financial Statements 108 International Business Machines Corporation and Subsidiary Companies Pre-swap annual contractual maturities of long-term debt outstanding at December 31, 2011, are as follows: ($ in millions) Total 2012 2013 2014 2015 2016 2017 and beyond Total $ 4,311... -
Page 111
... to estimate fair values at each future reporting date. The related liability will be recognized once sufficient additional information becomes available. The total amounts accrued for ARO liabilities, including amounts classified as current in the Consolidated Statement of Financial Position were... -
Page 112
...common shares at a cost of $161 million in 2011, 2010 and 2009, respectively, were remitted by employees to the company in order to satisfy minimum statutory tax withholding requirements. These amounts are included in the treasury stock balance in the Consolidated Statement of Financial Position and... -
Page 113
Notes to Consolidated Financial Statements International Business Machines Corporation and Subsidiary Companies 111 Taxes Related to Items of Other Comprehensive Income ($ in millions) For the year ended December 31, 2011: Before Tax Amount Tax (Expense)/ Beneï¬t Net of Tax Amount Other ... -
Page 114
... Financial Statements 112 International Business Machines Corporation and Subsidiary Companies ($ in millions) For the year ended December 31, 2009: Before Tax Amount Tax (Expense)/ Beneï¬t Net of Tax Amount Other comprehensive income: Foreign currency translation adjustments Net changes related... -
Page 115
Notes to Consolidated Financial Statements International Business Machines Corporation and Subsidiary Companies 113 liabilities for the years ended December 31, 2011, 2010 and 2009 were not material to the Consolidated Financial Statements. In accordance with the relevant accounting guidance, the ... -
Page 116
Notes to Consolidated Financial Statements 114 International Business Machines Corporation and Subsidiary Companies of social service program processing in Indiana. The State terminated the contract, claiming that IBM was in breach, and the State is seeking damages. IBM believes the State's claims... -
Page 117
.... The fair value of the guarantees recognized in the Consolidated Statement of Financial Position is not material. The components of the provision for income taxes by taxing jurisdiction are as follows: ($ in millions) For the year ended December 31: 2011 2010 2009 U.S. federal Current Deferred... -
Page 118
... ending amount of unrecognized tax benefits is as follows: ($ in millions) Deferred Tax Assets ($ in millions) At December 31: 2011 2010 2011 2010 2009 Balance at January 1 Additions based on tax positions related to the current year Additions for tax positions of prior years Reductions for tax... -
Page 119
... to the development of new and improved products and their uses, as well as services and their application. Within these amounts, software-related expense was $3,097 million, $3,028 million and $2,991 million in 2011, 2010 and 2009, respectively. Expense for product-related engineering was $267... -
Page 120
... the employee requisite service period. See note A, "Significant Accounting Policies," on page 82 for additional information. The following table presents total stock-based compensation cost included in the Consolidated Statement of Earnings. ($ in millions) For the year ended December 31: 2011 2010... -
Page 121
...value made by the company. During the years ended December 31, 2011, 2010 and 2009, the company did not grant stock options. The following table summarizes option activity under the Plans during the years ended December 31, 2011, 2010 and 2009. 2011 Weighted Average Exercise Price Number of Shares... -
Page 122
... targets. The ultimate number of shares issued and the related compensation cost recognized as expense will be based on a comparison of the final performance metrics to the specified targets. The fair value of PSUs granted at target during the years ended December 31, 2011, 2010 and 2009 was... -
Page 123
...Machines Corporation and Subsidiary Companies 121 In connection with vesting and release of RSUs and PSUs, the tax benefits realized by the company for the years ended December 31, 2011, 2010 and 2009 were $283 million, $293 million and $156 million, respectively. IBM Employees Stock Purchase Plan... -
Page 124
...Financial Information The following table presents a summary of the total retirement-related benefits net periodic (income)/cost recorded in the Consolidated Statement of Earnings. ($ in millions) U.S. Plans For the year ended December 31: 2011 2010 2009 2011 Non-U.S. Plans 2010 2009 2011 Total 2010... -
Page 125
... benefit plans (benefit obligations), fair value of plan assets and the associated funded status recorded in the Consolidated Statement of Financial Position. ($ in millions) Beneï¬t Obligations At December 31: 2011 2010 Fair Value of Plan Assets 2011 2010 Funded Status* 2011 2010 U.S. Plans... -
Page 126
...retirement-related benefit plans recognized in Consolidated Statement of Earnings, excluding defined contribution plans. ($ in millions) Deï¬ned Beneï¬t Pension Plans U.S. Plans For the year ended December 31: 2011 2010 2009 2011 Non-U.S. Plans 2010 2009 Service cost Interest cost Expected return... -
Page 127
... the use of those plan assets. + Represents the benefit obligation assuming no future participant compensation increases. N/A-Not applicable The following table presents the net funded status recognized in the Consolidated Statement of Financial Position. ($ in millions) Deï¬ned Beneï¬t Pension... -
Page 128
... Statements 126 International Business Machines Corporation and Subsidiary Companies ($ in millions) Deï¬ned Beneï¬t Pension Plans U.S. Plans 2011 2010 Non-U.S. Plans 2011 2010 Nonpension Postretirement Beneï¬t Plans U.S. Plan 2011 2010 Non-U.S. Plans 2011 2010 Net loss at January 1 Current... -
Page 129
... benefit plans. Deï¬ned Beneï¬t Pension Plans U.S. Plans 2011 2010 2009 2011 Non-U.S. Plans 2010 2009 Weighted-average assumptions used to measure net periodic (income)/cost for the year ended December 31: Discount rate Expected long-term returns on plan assets Rate of compensation increase... -
Page 130
... benefit plans, the company maintains a nominal, highly liquid trust fund balance to ensure timely payments are made. As a result, for the years ended December 31, 2011, 2010 and 2009, the expected long-term return on plan assets and the actual return on those assets were not material. Rate... -
Page 131
Notes to Consolidated Financial Statements International Business Machines Corporation and Subsidiary Companies 129 Plan Assets Retirement-related benefit plan assets are recognized and measured at fair value as described in note A, "Significant Accounting Policies," on page 84. Because of the ... -
Page 132
...Consolidated Financial Statements 130 International Business Machines Corporation and Subsidiary Companies Defined Benefit Pension Plan assets The following table presents the company's defined benefit pension plans' asset classes and their associated fair value at December 31, 2011. The U.S. Plan... -
Page 133
Notes to Consolidated Financial Statements International Business Machines Corporation and Subsidiary Companies 131 The following table presents the company's defined benefit pension plans' asset classes and their associated fair value at December 31, 2010. The U.S. Plan consists of the Qualified ... -
Page 134
Notes to Consolidated Financial Statements 132 International Business Machines Corporation and Subsidiary Companies The following tables present the reconciliation of the beginning and ending balances of Level 3 assets for the years ended December 31, 2011 and 2010 for the U.S. Plan. ($ in ... -
Page 135
... plan assets at fair value. There were no changes in valuation techniques during 2011 and 2010. Equity securities are valued at the closing price reported on the stock exchange on which the individual securities are traded. IBM common stock is valued at the closing price reported on the New York... -
Page 136
...5,957 30,718 The 2012 expected benefit payments to defined benefit pension plan participants not covered by the respective plan assets (underfunded plans) represent a component of compensation and benefits, within current liabilities, in the Consolidated Statement of Financial Position. Nonpension... -
Page 137
...length leases and loans at prices equivalent to market rates with Global Financing to facilitate the acquisition of equipment used in services engagements. All internal transaction prices are reviewed annually, and reset if appropriate. The company utilizes globally integrated support organizations... -
Page 138
...Business Services Systems and Technology Global Financing Total Segments For the year ended December 31: Software 2011 External revenue Internal revenue Total revenue Pre-tax income Revenue year-to-year change Pre-tax income year-to-year change Pre-tax income margin 2010 External revenue Internal... -
Page 139
... Statements International Business Machines Corporation and Subsidiary Companies 137 Reconciliations of IBM as Reported ($ in millions) For the year ended December 31: 2011 2010 2009 Segment Assets and Other Items Global Technology Services assets are primarily accounts receivable, plant, property... -
Page 140
... International Business Machines Corporation and Subsidiary Companies Management System Segment View ($ in millions) Global Services Segments Global Technology Services Global Business Services Systems and Technology Global Financing Total Segments For the year ended December 31: Software 2011... -
Page 141
... year ended December 31: 2011 2010 2009 Assets Total reportable segments Elimination of internal transactions Unallocated amounts Cash and marketable securities Notes and accounts receivable Deferred tax assets Plant, other property and equipment Pension assets Other Total IBM consolidated assets... -
Page 142
Five-Year Comparison of Selected Financial Data 140 International Business Machines Corporation and Subsidiary Companies ($ in millions except per share amounts) For the year ended December 31: 2011 2010 2009 2008 2007 Revenue Net income Operating (non-GAAP) earnings** Earnings per share of ... -
Page 143
... for the full year is computed using the weighted-average number of shares outstanding during the year. Thus, the sum of the four quarters' EPS does not equal the full-year EPS. + The stock prices reflect the high and low prices for IBM's common stock on the New York Stock Exchange composite tape... -
Page 144
... 142 International Business Machines Corporation and Subsidiary Companies Comparison of One-, Five- and Ten-Year Cumulative Total Return for IBM, S&P 500 Stock Index and S&P Information Technology Index The following graphs compare the one-, five- and ten-year cumulative total returns for IBM... -
Page 145
Performance Graphs International Business Machines Corporation and Subsidiary Companies 143 Ten-Year (U.S. Dollar) 200 175 150 125 100 75 50 01 02 03 04 05 06 07 08 09 10 11 Ten-Year 2001 2002 2003 2004 2005 2006 2007 2008 2009 2010 2011 • IBM Common Stock • S & P 500 Index ... -
Page 146
... Vice President Marketing and Communications James J. Kavanaugh Vice President and Controller John E. Kelly III Senior Vice President and Director Research Robert J. LeBlanc Senior Vice President Middleware Software Group Mark Loughridge Senior Vice President and Chief Financial Officer Finance and... -
Page 147
... residing outside the United States, Canada and Puerto Rico should call (781) 575-2727. Investors with other requests may write to: IBM Stockholder Relations, New Orchard Road, Armonk, New York 10504 International Business Machines Corporation New Orchard Road, Armonk, New York 10504 (914) 499-1900... -
Page 148
Let's build a smarter planet.