ADT 2002 Annual Report Download - page 99
Download and view the complete annual report
Please find page 99 of the 2002 ADT annual report below. You can navigate through the pages in the report by either clicking on the pages listed below, or by using the keyword search tool below to find specific information within the annual report.-
 1
1 -
2
-
3
-
4
-
5
-
6
-
7
-
8
-
9
-
10
-
11
-
12
-
13
-
14
-
15
-
16
-
17
-
18
-
19
-
20
-
21
-
22
-
23
-
24
-
25
-
26
-
27
-
28
-
29
-
30
-
31
-
32
-
33
-
34
-
35
-
36
-
37
-
38
-
39
-
40
-
41
-
42
-
43
-
44
-
45
-
46
-
47
-
48
-
49
-
50
-
51
-
52
-
53
-
54
-
55
-
56
-
57
-
58
-
59
-
60
-
61
-
62
-
63
-
64
-
65
-
66
-
67
-
68
-
69
-
70
-
71
-
72
-
73
-
74
-
75
-
76
-
77
-
78
-
79
-
80
-
81
-
82
-
83
-
84
-
85
-
86
-
87
-
88
-
 89
89 -
 90
90 -
 91
91 -
 92
92 -
 93
93 -
 94
94 -
 95
95 -
 96
96 -
 97
97 -
 98
98 -
 99
99 -
 100
100 -
 101
101 -
 102
102 -
 103
103 -
 104
104 -
 105
105 -
 106
106 -
 107
107 -
 108
108 -
 109
109 -
110
-
111
-
112
-
113
-
114
-
115
-
116
-
117
-
118
-
119
-
120
-
121
-
122
-
123
-
124
-
125
-
126
-
127
-
128
-
129
-
130
-
131
-
132
-
133
-
134
-
135
-
136
-
137
-
138
-
139
-
140
-
141
-
142
-
143
-
144
-
145
-
146
-
147
-
148
-
149
-
150
-
151
-
152
-
153
-
154
-
155
-
156
-
157
-
158
-
159
-
160
-
161
-
162
-
163
-
164
-
165
-
166
-
167
-
168
-
169
-
170
-
171
-
172
-
173
-
174
-
175
-
176
-
177
-
178
-
179
-
180
-
181
-
182
 |
 |

TYCO INTERNATIONAL LTD.
NOTES TO CONSOLIDATED FINANCIAL STATEMENTS (continued)
11. Discontinued Operations of Tyco Capital (CIT Group Inc.) (continued)
are designated as a cash flow hedge. If a derivative is designated as a cash flow hedge, the effective
portions of changes in the fair value of the derivative are recorded in other comprehensive (loss)
income and are recognized in the Consolidated Statement of Operations when the hedged item affects
earnings. Ineffective portions of changes in the fair value of cash flow hedges are recognized as a
charge or credit to earnings.
12. Cumulative Effect of Accounting Changes
In December 1999, the SEC issued SAB 101, in which the SEC expressed its views regarding the
appropriate recognition of revenue with respect to a variety of circumstances, some of which are
relevant to the Company. As required under SAB 101, the Company modified its revenue recognition
policies with respect to the installation of electronic security systems (see ‘‘Revenue Recognition’’ within
Note 1). In addition, in response to SAB 101, the Company undertook a review of its revenue
recognition practices and identified certain provisions included in a limited number of sales
arrangements that delayed the recognition of revenue under SAB 101. During the fourth quarter of
fiscal 2001, the Company changed its method of accounting for these items retroactive to the beginning
of the fiscal year to conform to the requirements of SAB 101. This was reported as a $653.7 million
after-tax ($1,005.6 million pre-tax) charge for the cumulative effect of change in accounting principle in
the fiscal 2001 Consolidated Statement of Operations.
During fiscal 2002, the Company recognized $294.2 million of revenue that had previously been
included in the SAB 101 cumulative effect adjustment recorded as of October 1, 2000. The impact of
SAB 101 on net revenues in fiscal 2001 was a net decrease of $241.1 million, reflecting the deferral of
$520.5 million of fiscal 2001 revenues, partially offset by the recognition of $279.4 million of revenue
that is included in the cumulative effect adjustment as of the beginning of the fiscal year.
The Company recorded a cumulative effect adjustment, a $29.7 million loss, net of tax, in fiscal
2001 in accordance with the transition provisions of SFAS No. 133.
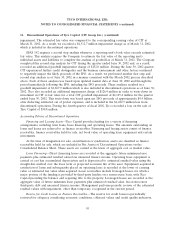
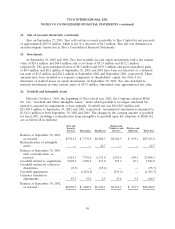
13. (Loss) Earnings Per Common Share
The reconciliations between basic and diluted (loss) earnings per common share are as follows
($ in millions, except per share data):
For the Year Ended For the Year Ended For the Year Ended
September 30, 2002 September 30, 2001 September 30, 2000
Per Share Per Share Per Share
Loss Shares Amount Income Shares Amount Income Shares Amount
Basic (loss) earnings per common share:
(Loss) income from continuing operations,
as restated ....................$(2,838.2)1,988.5 $(1.43) $3,894.9 1,806.9 $2.16 $4,318.5 1,688.0 $2.56
Stock options and warrants ........... — — — 21.4 — 21.2
Exchange of convertible debt due 2010 .... — — 1.1 3.3 1.5 4.0
Diluted (loss) earnings per common share:
(Loss) income from continuing operations,
giving effect to dilutive adjustments, as
restated ......................$(2,838.2) 1,988.5 $(1.43) $3,896.0 1,831.6 $2.13 $4,320.0 1,713.2 $2.52
97