ADT 2002 Annual Report Download - page 79
Download and view the complete annual report
Please find page 79 of the 2002 ADT annual report below. You can navigate through the pages in the report by either clicking on the pages listed below, or by using the keyword search tool below to find specific information within the annual report.-
 1
1 -
2
-
3
-
4
-
5
-
6
-
7
-
8
-
9
-
10
-
11
-
12
-
13
-
14
-
15
-
16
-
17
-
18
-
19
-
20
-
21
-
22
-
23
-
24
-
25
-
26
-
27
-
28
-
29
-
30
-
31
-
32
-
33
-
34
-
35
-
36
-
37
-
38
-
39
-
40
-
41
-
42
-
43
-
44
-
45
-
46
-
47
-
48
-
49
-
50
-
51
-
52
-
53
-
54
-
55
-
56
-
57
-
58
-
59
-
60
-
61
-
62
-
63
-
64
-
65
-
66
-
67
-
68
-
 69
69 -
 70
70 -
 71
71 -
 72
72 -
 73
73 -
 74
74 -
 75
75 -
 76
76 -
 77
77 -
 78
78 -
 79
79 -
 80
80 -
 81
81 -
 82
82 -
 83
83 -
 84
84 -
 85
85 -
 86
86 -
 87
87 -
 88
88 -
 89
89 -
90
-
91
-
92
-
93
-
94
-
95
-
96
-
97
-
98
-
99
-
100
-
101
-
102
-
103
-
104
-
105
-
106
-
107
-
108
-
109
-
110
-
111
-
112
-
113
-
114
-
115
-
116
-
117
-
118
-
119
-
120
-
121
-
122
-
123
-
124
-
125
-
126
-
127
-
128
-
129
-
130
-
131
-
132
-
133
-
134
-
135
-
136
-
137
-
138
-
139
-
140
-
141
-
142
-
143
-
144
-
145
-
146
-
147
-
148
-
149
-
150
-
151
-
152
-
153
-
154
-
155
-
156
-
157
-
158
-
159
-
160
-
161
-
162
-
163
-
164
-
165
-
166
-
167
-
168
-
169
-
170
-
171
-
172
-
173
-
174
-
175
-
176
-
177
-
178
-
179
-
180
-
181
-
182
 |
 |

TYCO INTERNATIONAL LTD.
NOTES TO CONSOLIDATED FINANCIAL STATEMENTS (continued)
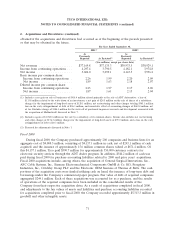
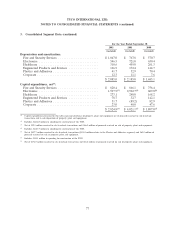
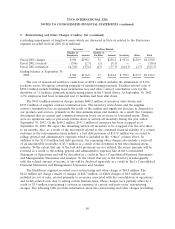
3. Consolidated Segment Data (continued)
For the Year Ended September 30,
2002 2001 2000
(restated) (restated) (restated)
Depreciation and amortization:
Fire and Security Services ....................... $ 1,047.0 $ 767.8 $ 570.7
Electronics .................................. 546.5 721.0 630.4
Healthcare .................................. 310.6 459.8 261.3
Engineered Products and Services ................. 126.9 172.4 144.7
Plastics and Adhesives .......................... 41.7 52.9 70.4
Corporate ................................... 12.3 11.1 7.6
$ 2,085.0 $ 2,185.0 $ 1,685.1
Capital expenditures, net(1):
Fire and Security Services ....................... $ 820.4 $ 866.1 $ 756.4
Electronics .................................. 1,597.9(2) 2,922.7(4) 609.8(6)
Healthcare .................................. 273.1 248.8 168.2
Engineered Products and Services ................. 78.7 32.7 142.1
Plastics and Adhesives .......................... 31.7 (89.2) 82.9
Corporate ................................... 23.0 40.0 47.6
$ 2,824.8(3) $ 4,021.1(5) $ 1,807.0(7)
(1) Capital expenditures presented in this table represent purchases of property, plant and equipment net of proceeds received in sale-leaseback
transactions and in sale/disposition of property, plant and equipment.
(2) Includes $1,146.0 million in spending for construction of the TGN.
(3) Net of $29.5 million received in sale-leaseback transactions and $166.2 million of proceeds received on sale of property, plant and equipment.
(4) Includes $2,247.7 million in spending for construction of the TGN.
(5) Net of $427.7 million received in sale-leaseback transactions ($135.0 million relates to the Plastics and Adhesives segment) and $62.0 million of
proceeds received on sale of property, plant and equipment.
(6) Includes $111.1 million in spending for construction of the TGN.
(7) Net of $172.0 million received in sale-leaseback transactions and $61.6 million of proceeds received on sale of property, plant and equipment.
77