ADT 2002 Annual Report Download - page 146
Download and view the complete annual report
Please find page 146 of the 2002 ADT annual report below. You can navigate through the pages in the report by either clicking on the pages listed below, or by using the keyword search tool below to find specific information within the annual report.-
 1
1 -
2
-
3
-
4
-
5
-
6
-
7
-
8
-
9
-
10
-
11
-
12
-
13
-
14
-
15
-
16
-
17
-
18
-
19
-
20
-
21
-
22
-
23
-
24
-
25
-
26
-
27
-
28
-
29
-
30
-
31
-
32
-
33
-
34
-
35
-
36
-
37
-
38
-
39
-
40
-
41
-
42
-
43
-
44
-
45
-
46
-
47
-
48
-
49
-
50
-
51
-
52
-
53
-
54
-
55
-
56
-
57
-
58
-
59
-
60
-
61
-
62
-
63
-
64
-
65
-
66
-
67
-
68
-
69
-
70
-
71
-
72
-
73
-
74
-
75
-
76
-
77
-
78
-
79
-
80
-
81
-
82
-
83
-
84
-
85
-
86
-
87
-
88
-
89
-
90
-
91
-
92
-
93
-
94
-
95
-
96
-
97
-
98
-
99
-
100
-
101
-
102
-
103
-
104
-
105
-
106
-
107
-
108
-
109
-
110
-
111
-
112
-
113
-
114
-
115
-
116
-
117
-
118
-
119
-
120
-
121
-
122
-
123
-
124
-
125
-
126
-
127
-
128
-
129
-
130
-
131
-
132
-
133
-
134
-
135
-
 136
136 -
 137
137 -
 138
138 -
 139
139 -
 140
140 -
 141
141 -
 142
142 -
 143
143 -
 144
144 -
 145
145 -
 146
146 -
 147
147 -
 148
148 -
 149
149 -
 150
150 -
 151
151 -
 152
152 -
 153
153 -
 154
154 -
 155
155 -
 156
156 -
157
-
158
-
159
-
160
-
161
-
162
-
163
-
164
-
165
-
166
-
167
-
168
-
169
-
170
-
171
-
172
-
173
-
174
-
175
-
176
-
177
-
178
-
179
-
180
-
181
-
182
 |
 |

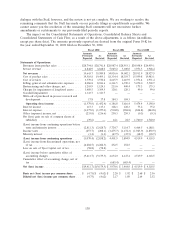
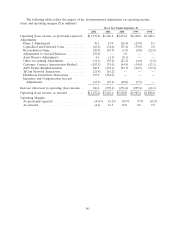
The following table details net revenues and earnings in fiscal 2002, fiscal 2001 and fiscal 2000, as
restated ($ in millions):
Fiscal 2002 Fiscal 2001 Fiscal 2000
Revenue from product sales ............................. $28,741.8 $28,953.1 $24,959.1
Service revenue ...................................... 6,848.0 5,049.0 3,968.4
Net revenues ........................................ $35,589.8 $34,002.1 $28,927.5
Restructuring and other charges, net(1) ...................... $(1,874.7) $ (585.3) $ (176.3)
Charges for the impairment of long-lived assets ............... (3,309.5) (120.1) (99.0)
Goodwill impairment .................................. (1,343.7) — —
Write-off of purchased in-process research and development ...... (17.8) (184.3) —
Total charges included in operating income .................. $(6,545.7) $ (889.7) $ (275.3)
Operating (loss) income after (charges) credits, net ............ $(1,452.4) $ 6,159.4 $ 5,542.4
Amortization of goodwill ................................ — (543.0) (344.4)
Total operating (loss) income ............................. (1,452.4) 5,616.4 5,198.0
Net gain on sale of common shares of a subsidiary ............. — 24.5 1,760.0
Net gain on sale of businesses ............................ 23.6 410.4 —
Loss on investments ................................... (270.8) (133.8) —
Interest expense, net ................................... (959.7) (776.5) (769.6)
Income (loss) from early retirement of debt .................. 30.6 (26.3) (0.3)
(Loss) income from continuing operations before income taxes and
minority interest .................................... (2,628.7) 5,114.7 6,188.1
Income taxes ........................................ (208.1) (1,172.3) (1,850.9)
Minority interest ...................................... (1.4) (47.5) (18.7)
(Loss) income from continuing operations ................... (2,838.2) 3,894.9 4,318.5
(Loss) income from discontinued operations of Tyco Capital, net of
tax .............................................. (6,282.5) 252.5 —
Loss on sale of Tyco Capital, net of tax ..................... (58.8) — —
(Loss) income before cumulative effect of accounting changes ..... (9,179.5) 4,147.4 4,318.5
Cumulative effect of accounting changes, net of tax ............ — (683.4) —
Net (loss) income ..................................... $(9,179.5) $ 3,464.0 $ 4,318.5
(1) This amount includes restructuring and other charges related to inventory in the amount of $635.4 million, $184.9 million
and $1.0 million for fiscal 2002, 2001 and 2000, respectively, which have been deducted as part of cost of sales in the
Consolidated Statements of Operations. Similarly, this amount includes a charge related to a provision for bad debts in the
amount of $115.0 million for fiscal 2002 which has been deducted as part of selling, general and administrative expenses in
the Consolidated Statement of Operations.
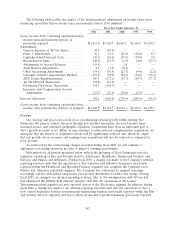
During fiscal 2002, we recorded restructuring and other charges and charges for the impairment of
long-lived assets related primarily to the significant decrease in demand in certain end markets within
our Electronics segment. Under our restructuring and integration programs, we terminate employees
and close facilities made redundant. The reduction in manpower and facilities comes from the
manufacturing, sales and administrative functions. In addition, we discontinue or dispose of product
lines which do not fit the long-term strategy of the respective businesses. We have not historically
tracked the impact on financial results of the restructuring and integration programs. However, we
estimate that our overall cost structure has been reduced by approximately $910 million on an
annualized basis, of which approximately $315 million relates to selling, general and administrative
expenses, and approximately $595 million to cost of sales. The $910 million estimated overall
annualized cost savings as a result of restructuring activities in fiscal 2002 was based on a summary of
estimated cost savings. In determining the amount of cost savings, management looked at the salaries
and benefits of the people that were terminated to derive the annual savings. As it relates to facility
144