ADT 2002 Annual Report Download - page 167
Download and view the complete annual report
Please find page 167 of the 2002 ADT annual report below. You can navigate through the pages in the report by either clicking on the pages listed below, or by using the keyword search tool below to find specific information within the annual report.-
 1
1 -
2
-
3
-
4
-
5
-
6
-
7
-
8
-
9
-
10
-
11
-
12
-
13
-
14
-
15
-
16
-
17
-
18
-
19
-
20
-
21
-
22
-
23
-
24
-
25
-
26
-
27
-
28
-
29
-
30
-
31
-
32
-
33
-
34
-
35
-
36
-
37
-
38
-
39
-
40
-
41
-
42
-
43
-
44
-
45
-
46
-
47
-
48
-
49
-
50
-
51
-
52
-
53
-
54
-
55
-
56
-
57
-
58
-
59
-
60
-
61
-
62
-
63
-
64
-
65
-
66
-
67
-
68
-
69
-
70
-
71
-
72
-
73
-
74
-
75
-
76
-
77
-
78
-
79
-
80
-
81
-
82
-
83
-
84
-
85
-
86
-
87
-
88
-
89
-
90
-
91
-
92
-
93
-
94
-
95
-
96
-
97
-
98
-
99
-
100
-
101
-
102
-
103
-
104
-
105
-
106
-
107
-
108
-
109
-
110
-
111
-
112
-
113
-
114
-
115
-
116
-
117
-
118
-
119
-
120
-
121
-
122
-
123
-
124
-
125
-
126
-
127
-
128
-
129
-
130
-
131
-
132
-
133
-
134
-
135
-
136
-
137
-
138
-
139
-
140
-
141
-
142
-
143
-
144
-
145
-
146
-
147
-
148
-
149
-
150
-
151
-
152
-
153
-
154
-
155
-
156
-
 157
157 -
 158
158 -
 159
159 -
 160
160 -
 161
161 -
 162
162 -
 163
163 -
 164
164 -
 165
165 -
 166
166 -
 167
167 -
 168
168 -
 169
169 -
 170
170 -
 171
171 -
 172
172 -
 173
173 -
 174
174 -
 175
175 -
 176
176 -
 177
177 -
178
-
179
-
180
-
181
-
182
 |
 |

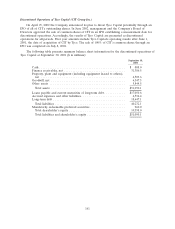
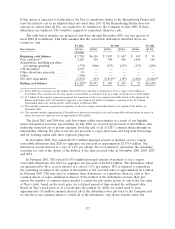
Fiscal 2002 Fiscal 2001 Fiscal 2000
($ in millions)
Operating (loss) income from continuing operations ..............$(1,452.4) 5,616.4 5,198.0
Non-cash restructuring and other charges, net .................. 796.5 312.0 (84.2)
Charges for the impairment of long-lived assets ................. 3,309.5 120.1 99.0
Goodwill impairment .................................... 1,343.7 — —
Write-off of purchased in-process research and development ........ 17.8 184.3 —
Depreciation and amortization(1) ............................ 2,085.0 1,642.0 1,340.7
Net (decrease) increase in deferred income taxes ................ (585.2) 107.3 434.6
Provision for losses on accounts receivable and inventory .......... 501.6 598.2 354.3
Less:
Net decrease (increase) in working capital, excluding current
maturities of debt(2) .................................. 834.2 (836.1) (91.8)
Expenditures relating to restructuring and other charges(3) ....... (517.5) (215.5) (155.2)
(Decrease in) proceeds under sale of accounts receivable program . . (56.4) 490.6 100.0
Interest expense, net ................................... (959.7) (776.5) (769.6)
Income tax expense ................................... (208.1) (1,172.3) (1,850.9)
Other, net .......................................... 304.5 619.6 581.5
Cash flow from operating activities from continuing operations ...... 5,413.5 6,690.1 5,156.4
Less:
Capital expenditures(4) .................................. (1,678.8) (1,773.4) (1,695.9)
Dividends paid ....................................... (100.3) (90.0) (86.2)
Decreases in (proceeds received) under the sale of accounts
receivable programs .................................. 56.4 (490.6) (100.0)
Construction of Tyco Global Network ...................... (1,146.0) (2,247.7) (111.1)
Free cash flow(5) ........................................$2,544.8 $ 2,088.4 $ 3,163.2
(1) This amount is the sum of depreciation of tangible property ($1,464.1 million, $1,242.7 million and $1,094.9 million in fiscal
2002, fiscal 2001 and fiscal 2000, respectively) and amortization of intangible assets other than goodwill ($620.9 million,
$399.3 million and $245.8 million in fiscal 2002, fiscal 2001 and fiscal 2000, respectively).
(2) This amount excludes cash paid out for restructuring and other charges.
(3) This amount is cash paid out for restructuring and other charges.
(4) This amount is net of proceeds of $29.5 million, $427.7 million and $172.0 million received in sale-leaseback transactions for
fiscal 2002, fiscal 2001 and fiscal 2000, respectively. It is also net of proceeds of $166.2 million, $62.0 million and
$61.6 million received in sale/disposition of property, plant and equipment in fiscal 2002, fiscal 2001 and fiscal 2000,
respectively.
(5) This amount is before cash payments for purchase accounting and holdback/earn-out liabilities of $624.1 million,
$878.7 million and $544.2 million in fiscal 2002, fiscal 2001 and fiscal 2000, respectively.
165