ADT 2002 Annual Report Download - page 150
Download and view the complete annual report
Please find page 150 of the 2002 ADT annual report below. You can navigate through the pages in the report by either clicking on the pages listed below, or by using the keyword search tool below to find specific information within the annual report.-
 1
1 -
2
-
3
-
4
-
5
-
6
-
7
-
8
-
9
-
10
-
11
-
12
-
13
-
14
-
15
-
16
-
17
-
18
-
19
-
20
-
21
-
22
-
23
-
24
-
25
-
26
-
27
-
28
-
29
-
30
-
31
-
32
-
33
-
34
-
35
-
36
-
37
-
38
-
39
-
40
-
41
-
42
-
43
-
44
-
45
-
46
-
47
-
48
-
49
-
50
-
51
-
52
-
53
-
54
-
55
-
56
-
57
-
58
-
59
-
60
-
61
-
62
-
63
-
64
-
65
-
66
-
67
-
68
-
69
-
70
-
71
-
72
-
73
-
74
-
75
-
76
-
77
-
78
-
79
-
80
-
81
-
82
-
83
-
84
-
85
-
86
-
87
-
88
-
89
-
90
-
91
-
92
-
93
-
94
-
95
-
96
-
97
-
98
-
99
-
100
-
101
-
102
-
103
-
104
-
105
-
106
-
107
-
108
-
109
-
110
-
111
-
112
-
113
-
114
-
115
-
116
-
117
-
118
-
119
-
120
-
121
-
122
-
123
-
124
-
125
-
126
-
127
-
128
-
129
-
130
-
131
-
132
-
133
-
134
-
135
-
136
-
137
-
138
-
139
-
 140
140 -
 141
141 -
 142
142 -
 143
143 -
 144
144 -
 145
145 -
 146
146 -
 147
147 -
 148
148 -
 149
149 -
 150
150 -
 151
151 -
 152
152 -
 153
153 -
 154
154 -
 155
155 -
 156
156 -
 157
157 -
 158
158 -
 159
159 -
 160
160 -
161
-
162
-
163
-
164
-
165
-
166
-
167
-
168
-
169
-
170
-
171
-
172
-
173
-
174
-
175
-
176
-
177
-
178
-
179
-
180
-
181
-
182
 |
 |

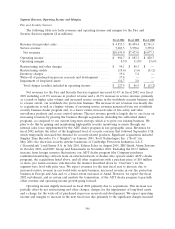
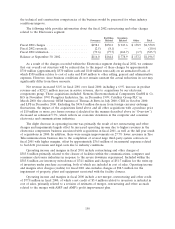
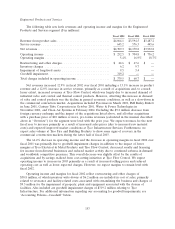
write-downs of $5.4 million are included in cost of sales, primarily related to the closure of facilities
that became redundant due to the acquisitions of SecurityLink and Simplex, partially offset by a credit
of $1.6 million relating to prior years’ restructuring charges. Also included are charges of $2.8 million
for the impairment of property, plant and equipment primarily associated with the facility closures.
Operating income and margins in fiscal 2000 includes a restructuring and other credit of
$11.2 million primarily related to a revision in estimates of our prior charges. As required under
SAB 101, we modified our revenue recognition policies with respect to the installation of electronic
security systems as of the beginning of fiscal 2001. See Cumulative Effect of Accounting Changes below.
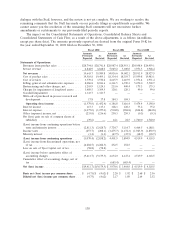
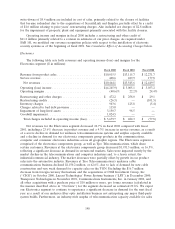
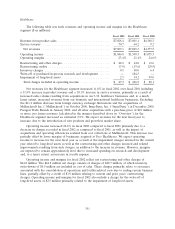
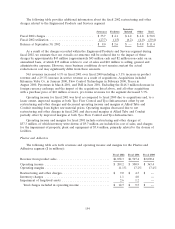
Electronics
The following table sets forth revenues and operating income (loss) and margins for the
Electronics segment ($ in millions):
Fiscal 2002 Fiscal 2001 Fiscal 2000
Revenue from product sales ......................... $10,015.5 $13,115.7 $ 12,271.7
Service revenue .................................. 448.6 429.9 177.8
Net revenues .................................. $10,464.1 $13,545.6 $ 12,449.5
Operating (loss) income ............................ $(4,245.9) $ 3,005.1 $ 3,033.2
Operating margins ................................ (40.6)% 22.2% 24.4%
Restructuring and other charges ...................... $ 472.2 $ 258.0 $ 29.1
Restructuring credits .............................. (26.3) — (101.5)
Inventory charges ................................ 943.6 125.8 (5.4)
Charges related to bad debt provision .................. 115.0 — —
Impairment of long-lived assets ...................... 3,150.7 98.5 —
Goodwill impairment .............................. 1,024.5 — —
Total charges included in operating income (loss) ........ $ 5,679.7 $ 482.3 $ (77.8)
Net revenues for the Electronics segment decreased 22.7% in fiscal 2002 compared with fiscal
2001, including a 23.6% decrease in product revenue and a 4.3% increase in service revenue, as a result
of a severe decline in demand for undersea telecommunications systems and surplus capacity available
and a decline in demand for our electronics components group products in the communications,
computer and consumer electronics industries across all geographic regions. The Electronics segment is
comprised of the electronics components group, as well as Tyco Telecommunications, which share
certain customers. Revenues at the electronics components group decreased $1,931.3 million, or 16.5%,
reflecting a significant decrease in demand in certain end markets. Sales were impacted mostly by the
market decline in the telecommunications and computer industries and, to a lesser extent, the
industrial/commercial industry. The market decreases were partially offset by growth in our product
sales into the automotive industry. Revenues at Tyco Telecommunication’s undersea cable
communications business declined $1,150.2 million, or 62.6%, due to lack of demand for new cable
construction and very weak demand for capacity sales on the TGN. Excluding the $16.7 million
decrease from foreign currency fluctuations and the acquisitions of CIGI Investment Group, Inc.
(‘‘CIGI’’) in October 2000, Lucent Technologies’ Power Systems business (‘‘LPS’’) in December 2000,
Transpower Technologies in November 2001, Communications Instruments, Inc. in January 2002, and
all other acquisitions with a purchase price of $10 million or more, pro forma revenues (calculated in
the manner described above in ‘‘Overview’’) for the segment decreased an estimated 29.6%. We expect
our Electronics segment to continue to experience a significant decrease in demand for the next fiscal
year as a result of our undersea fiber optic installation business not anticipating any major third-party
system builds. Furthermore, an industry-wide surplus of telecommunication capacity available for sales
148