ADT 2002 Annual Report Download - page 131
Download and view the complete annual report
Please find page 131 of the 2002 ADT annual report below. You can navigate through the pages in the report by either clicking on the pages listed below, or by using the keyword search tool below to find specific information within the annual report.-
 1
1 -
2
-
3
-
4
-
5
-
6
-
7
-
8
-
9
-
10
-
11
-
12
-
13
-
14
-
15
-
16
-
17
-
18
-
19
-
20
-
21
-
22
-
23
-
24
-
25
-
26
-
27
-
28
-
29
-
30
-
31
-
32
-
33
-
34
-
35
-
36
-
37
-
38
-
39
-
40
-
41
-
42
-
43
-
44
-
45
-
46
-
47
-
48
-
49
-
50
-
51
-
52
-
53
-
54
-
55
-
56
-
57
-
58
-
59
-
60
-
61
-
62
-
63
-
64
-
65
-
66
-
67
-
68
-
69
-
70
-
71
-
72
-
73
-
74
-
75
-
76
-
77
-
78
-
79
-
80
-
81
-
82
-
83
-
84
-
85
-
86
-
87
-
88
-
89
-
90
-
91
-
92
-
93
-
94
-
95
-
96
-
97
-
98
-
99
-
100
-
101
-
102
-
103
-
104
-
105
-
106
-
107
-
108
-
109
-
110
-
111
-
112
-
113
-
114
-
115
-
116
-
117
-
118
-
119
-
120
-
 121
121 -
 122
122 -
 123
123 -
 124
124 -
 125
125 -
 126
126 -
 127
127 -
 128
128 -
 129
129 -
 130
130 -
 131
131 -
 132
132 -
 133
133 -
 134
134 -
 135
135 -
 136
136 -
 137
137 -
 138
138 -
 139
139 -
 140
140 -
 141
141 -
142
-
143
-
144
-
145
-
146
-
147
-
148
-
149
-
150
-
151
-
152
-
153
-
154
-
155
-
156
-
157
-
158
-
159
-
160
-
161
-
162
-
163
-
164
-
165
-
166
-
167
-
168
-
169
-
170
-
171
-
172
-
173
-
174
-
175
-
176
-
177
-
178
-
179
-
180
-
181
-
182
 |
 |

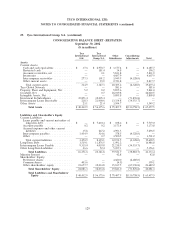
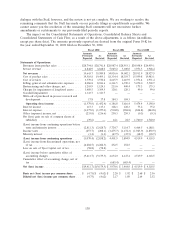
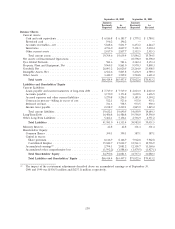
TYCO INTERNATIONAL LTD.
NOTES TO CONSOLIDATED FINANCIAL STATEMENTS (continued)
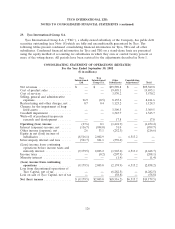
29. Tyco International Group S.A. (continued)
CONSOLIDATING BALANCE SHEET (RESTATED)
September 30, 2002
($ in millions)
Tyco Tyco
International International Other Consolidating
Ltd. Group S.A. Subsidiaries Adjustments Total
Assets
Current Assets:
Cash and cash equivalents .......... $ 37.6 $ 2,970.7 $ 3,177.4 $ — $ 6,185.7
Restricted cash .................. — 181.4 14.8 — 196.2
Accounts receivables, net ........... — 0.1 5,831.8 — 5,831.9
Inventories ..................... — — 4,607.9 — 4,607.9
Intercompany receivables ........... 277.3 101.2 3,949.5 (4,328.0) —
Other current assets ............... — 93.9 2,723.8 — 2,817.7
Total current assets .............. 314.9 3,347.3 20,305.2 (4,328.0) 19,639.4
Tyco Global Network ............... — — 581.6 — 581.6
Property, Plant and Equipment, Net ..... 5.2 0.2 9,855.6 — 9,861.0
Goodwill, Net .................... — 0.7 26,019.8 — 26,020.5
Intangible Assets, Net ............... — — 5,805.8 — 5,805.8
Investment In Subsidiaries ............ 39,871.4 32,005.4 — (71,876.8) —
Intercompany Loans Receivable ........ 218.3 21,000.6 13,334.8 (34,553.7) —
Other Assets ..................... 23.1 21.4 3,504.7 — 3,549.2
Total Assets ................. $40,432.9 $ 56,375.6 $ 79,407.5 $(110,758.5) $ 65,457.5
Liabilities and Shareholder’s Equity
Current Liabilities:
Loans payable and current maturities of
long-term debt ................. $ — $ 7,610.4 $ 108.6 $ — $ 7,719.0
Accounts payable ................ 0.2 0.2 3,173.4 — 3,173.8
Accrued expenses and other current
liabilities ..................... 35.8 267.2 4,993.5 — 5,296.5
Intercompany payables ............. 3,434.9 514.6 378.5 (4,328.0) —
Other ........................ — 0.7 3,500.5 — 3,501.2
Total current liabilities ........... 3,470.9 8,393.1 12,154.5 (4,328.0) 19,690.5
Long-Term Debt ................... 3,519.1 11,876.5 1,091.2 — 16,486.8
Intercompany Loans Payable .......... 9,315.0 4,019.8 21,218.9 (34,553.7) —
Other Long-Term Liabilities ........... 46.6 52.4 5,057.1 — 5,156.1
Total Liabilities .............. 16,351.6 24,341.8 39,521.7 (38,881.7) 41,333.4
Minority Interest .................. — — 42.8 — 42.8
Shareholders’ Equity:
Preference shares ................ — — 4,680.0 (4,680.0) —
Common shares ................. 403.6 — (4.5) — 399.1
Other shareholders’ equity .......... 23,677.7 32,033.8 35,167.5 (67,196.8) 23,682.2
Total Shareholders’ Equity ....... 24,081.3 32,033.8 39,843.0 (71,876.8) 24,081.3
Total Liabilities and Shareholders’
Equity ................... $40,432.9 $ 56,375.6 $ 79,407.5 $(110,758.5) $ 65,457.5
129