ADT 2002 Annual Report Download - page 168
Download and view the complete annual report
Please find page 168 of the 2002 ADT annual report below. You can navigate through the pages in the report by either clicking on the pages listed below, or by using the keyword search tool below to find specific information within the annual report.-
 1
1 -
2
-
3
-
4
-
5
-
6
-
7
-
8
-
9
-
10
-
11
-
12
-
13
-
14
-
15
-
16
-
17
-
18
-
19
-
20
-
21
-
22
-
23
-
24
-
25
-
26
-
27
-
28
-
29
-
30
-
31
-
32
-
33
-
34
-
35
-
36
-
37
-
38
-
39
-
40
-
41
-
42
-
43
-
44
-
45
-
46
-
47
-
48
-
49
-
50
-
51
-
52
-
53
-
54
-
55
-
56
-
57
-
58
-
59
-
60
-
61
-
62
-
63
-
64
-
65
-
66
-
67
-
68
-
69
-
70
-
71
-
72
-
73
-
74
-
75
-
76
-
77
-
78
-
79
-
80
-
81
-
82
-
83
-
84
-
85
-
86
-
87
-
88
-
89
-
90
-
91
-
92
-
93
-
94
-
95
-
96
-
97
-
98
-
99
-
100
-
101
-
102
-
103
-
104
-
105
-
106
-
107
-
108
-
109
-
110
-
111
-
112
-
113
-
114
-
115
-
116
-
117
-
118
-
119
-
120
-
121
-
122
-
123
-
124
-
125
-
126
-
127
-
128
-
129
-
130
-
131
-
132
-
133
-
134
-
135
-
136
-
137
-
138
-
139
-
140
-
141
-
142
-
143
-
144
-
145
-
146
-
147
-
148
-
149
-
150
-
151
-
152
-
153
-
154
-
155
-
156
-
157
-
 158
158 -
 159
159 -
 160
160 -
 161
161 -
 162
162 -
 163
163 -
 164
164 -
 165
165 -
 166
166 -
 167
167 -
 168
168 -
 169
169 -
 170
170 -
 171
171 -
 172
172 -
 173
173 -
 174
174 -
 175
175 -
 176
176 -
 177
177 -
 178
178 -
179
-
180
-
181
-
182
 |
 |

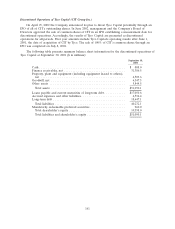
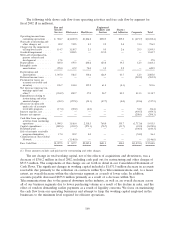
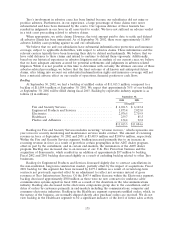
The following table shows cash flow from operating activities and free cash flow by segment for
fiscal 2002 ($ in millions).
Fire and Engineered
Security Products and Plastics
Services Electronics Healthcare Services and Adhesives Corporate Total
Operating income from
continuing operations . . . $ 904.7 $(4,245.9) $1,846.8 $252.5 209.2 $ (419.7) $(1,452.4)
Non-cash restructuring and
other charges, net ..... 20.2 732.5 0.5 9.5 2.4 31.4 796.5
Charges for the impairment
of long-lived assets ..... 114.7 3,150.7 2.5 9.5 2.6 29.5 3,309.5
Goodwill impairment ..... — 1,024.5 — 319.2 — — 1,343.7
Write-off of purchased in-
process research and
development ......... 17.8 — — — — — 17.8
Depreciation .......... 569.0 479.3 240.6 123.4 39.5 12.3 1,464.1
Intangible assets
amortization ......... 478.0 67.2 70.0 3.5 2.2 — 620.9
Depreciation and
amortization ......... 1,047.0 546.5 310.6 126.9 41.7 12.3 2,085.0
Deferred income taxes .... — — — — — (585.2) (585.2)
Provision for losses on
accounts receivable and
inventory ........... 196.7 104.4 139.2 61.4 (0.1) — 501.6
Net decrease (increase) in
working capital and
other(1) ............ (334.9) 890.7 57.0 28.7 83.9 413.3 1,138.7
Expenditures relating to
restructuring and other
unusual charges ....... (48.3) (297.8) (34.1) (47.7) (4.0) (85.6) (517.5)
(Decrease in) proceeds
under sale of accounts
receivable program ..... (17.4) (89.2) (4.0) — — 54.2 (56.4)
Interest expense, net ..... — — — — — (959.7) (959.7)
Income tax expense ...... — — — — — (208.1) (208.1)
Cash flow from operating
activities from continuing
operations .......... 1,900.5 1,816.4 2,318.5 760.0 335.7 (1,717.6) 5,413.5
Capital expenditures ..... (820.4) (451.9) (273.1) (78.7) (31.7) (23.0) (1,678.8)
Dividends paid ......... — — — — — (100.3) (100.3)
Sale of accounts receivable
program elimination .... 17.4 89.2 4.0 — — (54.2) 56.4
Construction of Tyco Global
Network ........... — (1,146.0) — — — — (1,146.0)
Free Cash Flow ........ $1,097.5 $ 307.7 $2,049.4 $681.3 304.0 $(1,895.1) $ 2,544.8
(1) These amounts exclude cash paid out for restructuring and other charges.
The net change in total working capital, net of the effects of acquisitions and divestitures, was a
decrease of $366.2 million in fiscal 2002, including cash paid out for restructuring and other charges of
$517.5 million. The components of this change are set forth in detail in our Consolidated Statement of
Cash Flows. The significant changes in working capital included a $1,071.5 million decrease in accounts
receivable due primarily to the collection on contracts within Tyco Telecommunications and, to a lesser
extent, an overall decrease within the electronics segment as a result of lower sales. In addition,
accounts payable decreased $833.8 million primarily as a result of a decrease within Tyco
Telecommunications due to the general downturn in the industry, as well as, an overall decrease across
all of our business segments due to lower purchasing volume as a result of the decline in sales, and the
effect of vendors demanding earlier payments as a result of liquidity concerns. We focus on maximizing
the cash flow from our operating businesses and attempt to keep the working capital employed in the
businesses to the minimum level required for efficient operations.
166