ADT 2002 Annual Report Download - page 80
Download and view the complete annual report
Please find page 80 of the 2002 ADT annual report below. You can navigate through the pages in the report by either clicking on the pages listed below, or by using the keyword search tool below to find specific information within the annual report.-
 1
1 -
2
-
3
-
4
-
5
-
6
-
7
-
8
-
9
-
10
-
11
-
12
-
13
-
14
-
15
-
16
-
17
-
18
-
19
-
20
-
21
-
22
-
23
-
24
-
25
-
26
-
27
-
28
-
29
-
30
-
31
-
32
-
33
-
34
-
35
-
36
-
37
-
38
-
39
-
40
-
41
-
42
-
43
-
44
-
45
-
46
-
47
-
48
-
49
-
50
-
51
-
52
-
53
-
54
-
55
-
56
-
57
-
58
-
59
-
60
-
61
-
62
-
63
-
64
-
65
-
66
-
67
-
68
-
69
-
 70
70 -
 71
71 -
 72
72 -
 73
73 -
 74
74 -
 75
75 -
 76
76 -
 77
77 -
 78
78 -
 79
79 -
 80
80 -
 81
81 -
 82
82 -
 83
83 -
 84
84 -
 85
85 -
 86
86 -
 87
87 -
 88
88 -
 89
89 -
 90
90 -
91
-
92
-
93
-
94
-
95
-
96
-
97
-
98
-
99
-
100
-
101
-
102
-
103
-
104
-
105
-
106
-
107
-
108
-
109
-
110
-
111
-
112
-
113
-
114
-
115
-
116
-
117
-
118
-
119
-
120
-
121
-
122
-
123
-
124
-
125
-
126
-
127
-
128
-
129
-
130
-
131
-
132
-
133
-
134
-
135
-
136
-
137
-
138
-
139
-
140
-
141
-
142
-
143
-
144
-
145
-
146
-
147
-
148
-
149
-
150
-
151
-
152
-
153
-
154
-
155
-
156
-
157
-
158
-
159
-
160
-
161
-
162
-
163
-
164
-
165
-
166
-
167
-
168
-
169
-
170
-
171
-
172
-
173
-
174
-
175
-
176
-
177
-
178
-
179
-
180
-
181
-
182
 |
 |

TYCO INTERNATIONAL LTD.
NOTES TO CONSOLIDATED FINANCIAL STATEMENTS (continued)
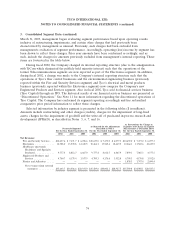
4. Consolidated Geographic Data
Selected information by geographic area is presented below ($ in millions).
As at and for the Year Ended September 30,
2002 2001 2000
(restated) (restated) (restated)
Total revenues:
United States ................................ $20,308.2 $ 19,728.0 $ 17,307.1
Other Americas (excluding United States) ........... 2,007.2 2,176.6 1,145.3
Europe ..................................... 8,358.2 7,591.0 6,610.0
Asia—Pacific ................................. 4,916.2 4,506.5 3,865.1
Net revenues from external customers(1) ........... $35,589.8 $ 34,002.1 $ 28,927.5
(1) Revenues from external customers are attributed to individual countries based on the reporting entity that records the
transaction.
As at and for the Year Ended September 30,
2002 2001 2000
(restated) (restated) (restated)
Long-lived assets:
United States ................................. $ 7,196.5 $ 5,754.7 $ 5,256.1
Other Americas (excluding United States) ............ 425.7 1,659.4 517.3
Europe ..................................... 2,606.3 4,325.2 1,947.2
Asia—Pacific ................................. 905.6 1,069.2 749.6
Corporate ................................... 455.2 620.1 395.5
$ 11,589.3 $ 13,428.6 $ 8,865.7
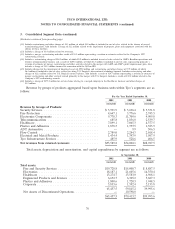
5. Restructuring and Other Charges (Credits), Net
Restructuring and other charges (credits), net, are as follows ($ in millions):
For the Year Ended September 30,
2002 2001 2000
(restated) (restated) (restated)
Fire and Security Services ......................... $ 94.9 $ 84.1 $ (11.2)
Electronics .................................... 1,504.5 383.8 (77.8)
Healthcare .................................... 44.8 48.4 (10.9)
Engineered Products and Services ................... 50.8 57.3 —
Plastics and Adhesives ........................... 10.1 8.3 —
Corporate .................................... 169.6 3.4 276.2
1,874.7 585.3 176.3
Less: Inventory related amounts charged to cost of sales . . . (635.4) (184.9) (1.0)
Bad debt provision charged to selling, general and
administrative expenses ....................... (115.0) — —
Restructuring and other unusual charges (credits), net .... $ 1,124.3 $ 400.4 $ 175.3
The Electronics segment for the year ended September 30, 2002 and the Corporate charges for the
years ended September 30, 2002 and September 30, 2001 have been restated by $(55.0) million,
$24.6 million and $166.8 million, respectively, to reflect the adjustments, described in Note 1.
78