ADT 2002 Annual Report Download - page 76
Download and view the complete annual report
Please find page 76 of the 2002 ADT annual report below. You can navigate through the pages in the report by either clicking on the pages listed below, or by using the keyword search tool below to find specific information within the annual report.-
 1
1 -
2
-
3
-
4
-
5
-
6
-
7
-
8
-
9
-
10
-
11
-
12
-
13
-
14
-
15
-
16
-
17
-
18
-
19
-
20
-
21
-
22
-
23
-
24
-
25
-
26
-
27
-
28
-
29
-
30
-
31
-
32
-
33
-
34
-
35
-
36
-
37
-
38
-
39
-
40
-
41
-
42
-
43
-
44
-
45
-
46
-
47
-
48
-
49
-
50
-
51
-
52
-
53
-
54
-
55
-
56
-
57
-
58
-
59
-
60
-
61
-
62
-
63
-
64
-
65
-
 66
66 -
 67
67 -
 68
68 -
 69
69 -
 70
70 -
 71
71 -
 72
72 -
 73
73 -
 74
74 -
 75
75 -
 76
76 -
 77
77 -
 78
78 -
 79
79 -
 80
80 -
 81
81 -
 82
82 -
 83
83 -
 84
84 -
 85
85 -
 86
86 -
87
-
88
-
89
-
90
-
91
-
92
-
93
-
94
-
95
-
96
-
97
-
98
-
99
-
100
-
101
-
102
-
103
-
104
-
105
-
106
-
107
-
108
-
109
-
110
-
111
-
112
-
113
-
114
-
115
-
116
-
117
-
118
-
119
-
120
-
121
-
122
-
123
-
124
-
125
-
126
-
127
-
128
-
129
-
130
-
131
-
132
-
133
-
134
-
135
-
136
-
137
-
138
-
139
-
140
-
141
-
142
-
143
-
144
-
145
-
146
-
147
-
148
-
149
-
150
-
151
-
152
-
153
-
154
-
155
-
156
-
157
-
158
-
159
-
160
-
161
-
162
-
163
-
164
-
165
-
166
-
167
-
168
-
169
-
170
-
171
-
172
-
173
-
174
-
175
-
176
-
177
-
178
-
179
-
180
-
181
-
182
 |
 |

TYCO INTERNATIONAL LTD.
NOTES TO CONSOLIDATED FINANCIAL STATEMENTS (continued)
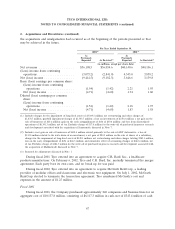
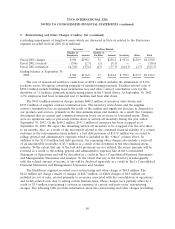
3. Consolidated Segment Data (continued)
March 31, 2003, management began evaluating segment performance based upon operating results
inclusive of restructuring, impairments, and certain other charges that had previously been
characterized by management as unusual. Previously, such charges had been excluded from
management’s evaluation of segment performance. Accordingly, operating (loss) income by segment has
been shown to reflect these changes. Prior year amounts have been conformed accordingly, and as
such, include the charges for amounts previously excluded from management’s internal reporting. These
items are footnoted in the table below.
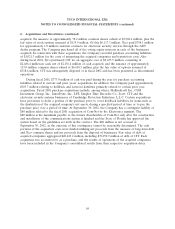
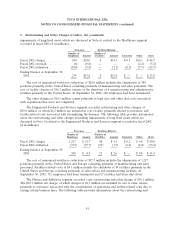
During fiscal 2002, the Company changed its internal reporting structure (due to the amalgamation
with TyCom which eliminated the publicly held minority interest) such that the operations of the
former Telecommunications segment are now reported as part of the Electronics segment. In addition,
during fiscal 2002, a change was made to the Company’s internal reporting structure such that the
operations of Tyco’s flow control businesses and the environmental engineering business (previously
reported within the Fire and Security Services segment) and Tyco’s electrical and metal products
business (previously reported within the Electronics segment) now comprise the Company’s new
Engineered Products and Services segment. Also in fiscal 2002, Tyco sold its financial services business
(Tyco Capital) through an IPO. The historical results of our financial services business are presented as
‘‘Discontinued Operations.’’ See Note 11 for more information regarding the discontinued operations of
Tyco Capital. The Company has conformed its segment reporting accordingly and has reclassified
comparative prior period information to reflect these changes.
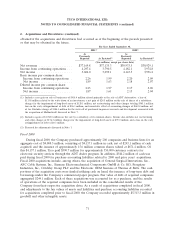
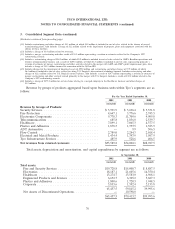
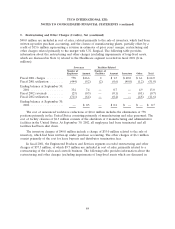
Selected information by industry segment is presented in the following tables ($ in millions).
Amounts include restructuring and other charges (credits), charges for the impairment of long-lived
assets, charges for the impairment of goodwill and the write-off of purchased in-process research and
development (IPR&D), as described in Notes 5, 6, 7, and 16.
As Restated for the Change in
As Restated for the Adjustments Segments and Change in Segment
Previously Reported Described in Note 1 Measurement as Described Above
For the Year Ended September 30, For the Year Ended September 30, For the Year Ended September 30,
2002 2001 2000 2002 2001 2000 2002 2001 2000
Net Revenues:
Fire and Security Services . . . $10,637.6 $ 7,471.7 $ 6,076.6 $10,639.0 $ 7,473.0 $ 6,077.3 $10,639.0 $ 7,473.0 $ 6,077.3
Electronics ............ 10,528.0 13,572.8 12,449.5 10,464.1 13,545.6 12,449.5 10,464.1 13,545.6 12,449.5
Healthcare (previously
Healthcare and Specialty
Products) ............ 9,777.4 8,812.7 6,467.9 9,777.4 8,812.7 6,467.9 7,899.1 7,065.3 4,377.5
Engineered Products and
Services ............. 4,700.7 4,179.4 3,937.9 4,709.3 4,170.8 3,932.8 4,709.3 4,170.8 3,932.8
Plastics and Adhesives .....——————1,878.3 1,747.4 2,090.4
Net revenues from external
customers .......... $35,643.7 $34,036.6 $28,931.9 $35,589.8 $34,002.1 $28,927.5 $35,589.8 $34,002.1 $28,927.5
74