ADT 2002 Annual Report Download - page 141
Download and view the complete annual report
Please find page 141 of the 2002 ADT annual report below. You can navigate through the pages in the report by either clicking on the pages listed below, or by using the keyword search tool below to find specific information within the annual report.-
 1
1 -
2
-
3
-
4
-
5
-
6
-
7
-
8
-
9
-
10
-
11
-
12
-
13
-
14
-
15
-
16
-
17
-
18
-
19
-
20
-
21
-
22
-
23
-
24
-
25
-
26
-
27
-
28
-
29
-
30
-
31
-
32
-
33
-
34
-
35
-
36
-
37
-
38
-
39
-
40
-
41
-
42
-
43
-
44
-
45
-
46
-
47
-
48
-
49
-
50
-
51
-
52
-
53
-
54
-
55
-
56
-
57
-
58
-
59
-
60
-
61
-
62
-
63
-
64
-
65
-
66
-
67
-
68
-
69
-
70
-
71
-
72
-
73
-
74
-
75
-
76
-
77
-
78
-
79
-
80
-
81
-
82
-
83
-
84
-
85
-
86
-
87
-
88
-
89
-
90
-
91
-
92
-
93
-
94
-
95
-
96
-
97
-
98
-
99
-
100
-
101
-
102
-
103
-
104
-
105
-
106
-
107
-
108
-
109
-
110
-
111
-
112
-
113
-
114
-
115
-
116
-
117
-
118
-
119
-
120
-
121
-
122
-
123
-
124
-
125
-
126
-
127
-
128
-
129
-
130
-
 131
131 -
 132
132 -
 133
133 -
 134
134 -
 135
135 -
 136
136 -
 137
137 -
 138
138 -
 139
139 -
 140
140 -
 141
141 -
 142
142 -
 143
143 -
 144
144 -
 145
145 -
 146
146 -
 147
147 -
 148
148 -
 149
149 -
 150
150 -
 151
151 -
152
-
153
-
154
-
155
-
156
-
157
-
158
-
159
-
160
-
161
-
162
-
163
-
164
-
165
-
166
-
167
-
168
-
169
-
170
-
171
-
172
-
173
-
174
-
175
-
176
-
177
-
178
-
179
-
180
-
181
-
182
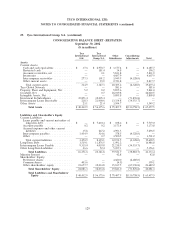
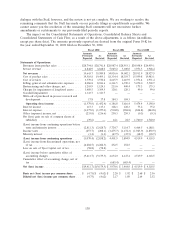
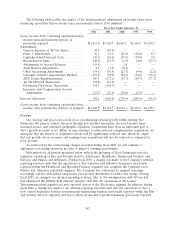
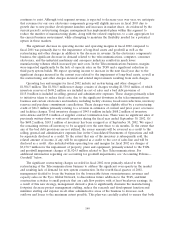
 |
 |

September 30, 2002 September 30, 2001
Amounts Amounts
Previously As Previously As
Reported Restated Reported Restated
Balance Sheets:
Current Assets:
Cash and cash equivalents ......................... $ 6,186.8 $ 6,185.7 $ 1,779.2 $ 1,780.1
Restricted cash ................................ 196.2 196.2 — —
Accounts receivables—net ......................... 5,848.6 5,831.9 6,453.2 6,444.7
Inventories ................................... 4,716.0 4,607.9 5,101.3 5,004.4
Other current assets ............................. 2,817.0 2,817.7 2,512.5 2,515.3
Total current assets ............................ 19,764.6 19,639.4 15,846.2 15,744.5
Net Assets of Discontinued Operations ................. — — 10,598.0 10,598.0
Tyco Global Network .............................. 581.6 581.6 2,342.4 2,353.4
Property, Plant and Equipment, Net ................... 9,969.5 9,861.0 9,970.3 9,898.3
Goodwill, Net ................................... 26,093.2 26,020.5 23,264.0 23,408.5
Intangible Assets, Net ............................. 6,562.6 5,805.8 5,476.9 4,789.3
Other Assets ................................... 3,442.9 3,549.2 3,524.8 3,621.2
Total Assets ................................. $66,414.4 $65,457.5 $71,022.6 $70,413.2
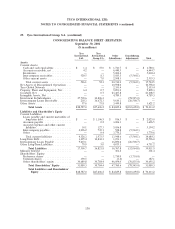
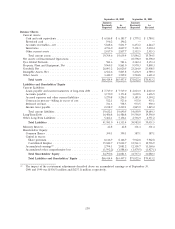
Liabilities and Shareholders’ Equity
Current Liabilities:
Loans payable and current maturities of long-term debt .... $7,719.0 $ 7,719.0 $ 2,023.0 $ 2,023.0
Accounts payable ............................... 3,170.0 3,173.8 3,692.6 3,696.5
Accrued expenses and other current liabilities ........... 5,270.8 5,296.5 5,181.8 5,194.2
Contracts in process—billing in excess of cost ........... 522.1 523.6 935.0 935.1
Deferred revenue ............................... 731.3 758.5 973.5 990.3
Income taxes payable ............................ 2,218.9 2,219.1 1,845.0 1,845.2
Total current liabilities .......................... 19,632.1 19,690.5 14,650.9 14,684.3
Long-Term Debt ................................. 16,486.8 16,486.8 19,596.0 19,596.0
Other Long-Term Liabilities ......................... 5,462.1 5,156.1 4,736.9 4,751.2
Total Liabilities .............................. 41,581.0 41,333.4 38,983.8 39,031.5
Minority Interest ................................. 42.8 42.8 301.4 301.4
Shareholders’ Equity:
Common Shares ............................... 399.1 399.1 387.1 387.1
Capital in excess:
Share premium ............................... 8,146.9 8,146.9 7,962.8 7,962.8
Contributed Surplus ........................... 15,042.7 15,042.7 12,561.3 12,796.9
Accumulated earnings(1) .......................... 2,794.1 2,081.2 12,305.7 11,360.6
Accumulated other comprehensive loss ................ (1,592.2) (1,588.6) (1,479.5) (1,427.1)
Total Shareholders’ Equity ....................... 24,790.6 24,081.3 31,737.4 31,080.3
Total Liabilities and Shareholders’ Equity ............ $66,414.4 $65,457.5 $71,022.6 $70,413.2
(1) The impact of the restatement adjustments described above on accumulated earnings as of September 30,
2000 and 1999 was $(438.5) million and $(237.1) million, respectively.
139