ADT 2002 Annual Report Download - page 155
Download and view the complete annual report
Please find page 155 of the 2002 ADT annual report below. You can navigate through the pages in the report by either clicking on the pages listed below, or by using the keyword search tool below to find specific information within the annual report.-
 1
1 -
2
-
3
-
4
-
5
-
6
-
7
-
8
-
9
-
10
-
11
-
12
-
13
-
14
-
15
-
16
-
17
-
18
-
19
-
20
-
21
-
22
-
23
-
24
-
25
-
26
-
27
-
28
-
29
-
30
-
31
-
32
-
33
-
34
-
35
-
36
-
37
-
38
-
39
-
40
-
41
-
42
-
43
-
44
-
45
-
46
-
47
-
48
-
49
-
50
-
51
-
52
-
53
-
54
-
55
-
56
-
57
-
58
-
59
-
60
-
61
-
62
-
63
-
64
-
65
-
66
-
67
-
68
-
69
-
70
-
71
-
72
-
73
-
74
-
75
-
76
-
77
-
78
-
79
-
80
-
81
-
82
-
83
-
84
-
85
-
86
-
87
-
88
-
89
-
90
-
91
-
92
-
93
-
94
-
95
-
96
-
97
-
98
-
99
-
100
-
101
-
102
-
103
-
104
-
105
-
106
-
107
-
108
-
109
-
110
-
111
-
112
-
113
-
114
-
115
-
116
-
117
-
118
-
119
-
120
-
121
-
122
-
123
-
124
-
125
-
126
-
127
-
128
-
129
-
130
-
131
-
132
-
133
-
134
-
135
-
136
-
137
-
138
-
139
-
140
-
141
-
142
-
143
-
144
-
 145
145 -
 146
146 -
 147
147 -
 148
148 -
 149
149 -
 150
150 -
 151
151 -
 152
152 -
 153
153 -
 154
154 -
 155
155 -
 156
156 -
 157
157 -
 158
158 -
 159
159 -
 160
160 -
 161
161 -
 162
162 -
 163
163 -
 164
164 -
 165
165 -
166
-
167
-
168
-
169
-
170
-
171
-
172
-
173
-
174
-
175
-
176
-
177
-
178
-
179
-
180
-
181
-
182
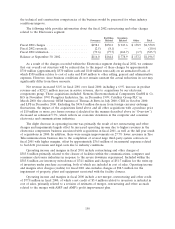
 |
 |

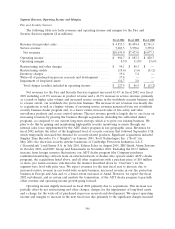
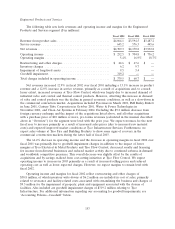
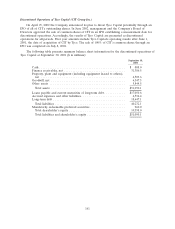
Engineered Products and Services
The following table sets forth revenues and operating income and margins for the Engineered
Products and Services segment ($ in millions):
Fiscal 2002 Fiscal 2001 Fiscal 2000
Revenue from product sales .............................. $4,064.1 $3,594.5 $3,487.2
Service revenue ....................................... 645.2 576.3 445.6
Net revenues ......................................... $4,709.3 $4,170.8 $3,932.8
Operating income ..................................... $ 252.5 $ 704.8 $ 736.2
Operating margins ..................................... 5.4% 16.9% 18.7%
Restructuring and other charges ........................... $ 44.6 $ 47.6 $ —
Inventory charges ..................................... 6.2 9.7 —
Impairment of long-lived assets ........................... 9.5 3.4 —
Goodwill impairment ................................... 319.2 — —
Total charges included in operating income ................... $ 379.5 $ 60.7 $ —
Net revenues increased 12.9% in fiscal 2002 over fiscal 2001 including a 13.1% increase in product
revenue and a 12.0% increase in service revenue, primarily as a result of acquisitions and, to a much
lesser extent, increased revenues at Tyco Flow Control, which was largely due to increased demand of
industrial valve and control and thermal control products. However, offsetting this increase in demand
of valve and control products was the decline in general economic conditions, as well as a slow-down in
the commercial contruction market. Acquisitions included Pyrotenax in March 2001, IMI Bailey Birkett
in June 2001, Century Tube Corporation in October 2001, Water & Power Technologies in
November 2001, and Clean Air Systems in February 2002. Excluding the $9.2 million decrease from
foreign currency exchange and the impact of the acquisitions listed above, and all other acquisitions
with a purchase price of $10 million or more, pro forma revenues (calculated in the manner described
above in ‘‘Overview’’) for the segment were level with the prior year. We expect revenues for the next
fiscal year to increase primarily as a result of increased sales prices (due to increased raw material
costs) and expected improved market conditions at Tyco Infrastructure Services. Furthermore, we
expect sales volume at Tyco Fire and Building Products to show some signs of recovery in the
commercial construction markets during the latter half of fiscal 2003.
The 64.2% decrease in operating income and the decrease in operating margins in fiscal 2002 over
fiscal 2001 was primarily due to goodwill impairment charges in addition to the impact of lower
margins at Tyco Electrical & Metal Products and Tyco Flow Control, decreased royalty and licensing
fee income from divested businesses and reduced market activity due to continued softness in demand
and worldwide competitive pressures. This overall decrease was slightly offset by the results of
acquisitions and by savings realized from cost-cutting initiatives at Tyco Flow Control. We expect
operating income to increase in 2003 primarily as a result of increased selling prices and reduced
operating cost as well as lower expected charges. However, we expect margins to remain level with
fiscal 2002.
Operating income and margins for fiscal 2002 reflect restructuring and other charges of
$50.8 million, of which inventory write-downs of $6.2 million are included in cost of sales, primarily
related to severance and facility-related costs associated with streamlining the business and charges of
$9.5 million for the impairment of property, plant and equipment associated with the closure of
facilities. Also included are goodwill impairment charges of $319.2 million relating to Tyco
Infrastructure. For additional information regarding our accounting for goodwill impairments, see
‘‘Accounting Policies—Goodwill’’ below.
153