ADT 2002 Annual Report Download - page 166
Download and view the complete annual report
Please find page 166 of the 2002 ADT annual report below. You can navigate through the pages in the report by either clicking on the pages listed below, or by using the keyword search tool below to find specific information within the annual report.-
 1
1 -
2
-
3
-
4
-
5
-
6
-
7
-
8
-
9
-
10
-
11
-
12
-
13
-
14
-
15
-
16
-
17
-
18
-
19
-
20
-
21
-
22
-
23
-
24
-
25
-
26
-
27
-
28
-
29
-
30
-
31
-
32
-
33
-
34
-
35
-
36
-
37
-
38
-
39
-
40
-
41
-
42
-
43
-
44
-
45
-
46
-
47
-
48
-
49
-
50
-
51
-
52
-
53
-
54
-
55
-
56
-
57
-
58
-
59
-
60
-
61
-
62
-
63
-
64
-
65
-
66
-
67
-
68
-
69
-
70
-
71
-
72
-
73
-
74
-
75
-
76
-
77
-
78
-
79
-
80
-
81
-
82
-
83
-
84
-
85
-
86
-
87
-
88
-
89
-
90
-
91
-
92
-
93
-
94
-
95
-
96
-
97
-
98
-
99
-
100
-
101
-
102
-
103
-
104
-
105
-
106
-
107
-
108
-
109
-
110
-
111
-
112
-
113
-
114
-
115
-
116
-
117
-
118
-
119
-
120
-
121
-
122
-
123
-
124
-
125
-
126
-
127
-
128
-
129
-
130
-
131
-
132
-
133
-
134
-
135
-
136
-
137
-
138
-
139
-
140
-
141
-
142
-
143
-
144
-
145
-
146
-
147
-
148
-
149
-
150
-
151
-
152
-
153
-
154
-
155
-
 156
156 -
 157
157 -
 158
158 -
 159
159 -
 160
160 -
 161
161 -
 162
162 -
 163
163 -
 164
164 -
 165
165 -
 166
166 -
 167
167 -
 168
168 -
 169
169 -
 170
170 -
 171
171 -
 172
172 -
 173
173 -
 174
174 -
 175
175 -
 176
176 -
177
-
178
-
179
-
180
-
181
-
182
 |
 |
Management’s objective in performing the SFAS 142 first step analysis was to obtain relevant
market-based data to calculate the estimated fair value of CIT as of March 31, 2002 based on its
projected earnings and market factors expected to be used by market participants in ascribing value to
CIT in the planned separation of CIT from Tyco. Management obtained relevant market data from our
financial advisors regarding the range of price to earnings multiples and market condition discounts
applicable to CIT as of March 31, 2002 and applied these market data to CIT’s projected annual
earnings as of March 31, 2002 to calculate an estimated fair value and any resulting goodwill
impairment. The estimated fair value was compared to the corresponding carrying value of CIT at
March 31, 2002. As a result, we recorded a $4,512.7 million impairment charge as of March 31, 2002,
which is included in discontinued operations.
SFAS 142 requires a second step analysis whenever a reporting unit’s book value exceeds estimated
fair value. This analysis requires that we estimate the fair value of the reporting unit’s individual assets
and liabilities to complete the analysis of goodwill as of March 31, 2002. We completed this second step
analysis for CIT during the quarter ended June 30, 2002 and, as a result, recorded an additional
goodwill impairment of $132.0 million. During the June 30, 2002 quarter, CIT experienced further
credit downgrades and the business environment and other factors continued to negatively impact the
likely proceeds of the IPO. As a result, we performed another first step and second step analysis as of
June 30, 2002 in a manner consistent with the March 2002 process described above. Each of these
analyses was based upon updated market data at June 30, 2002 and through the period immediately
following the IPO, including the IPO proceeds. These analyses resulted in a goodwill impairment of
$1,867.0 million, which is also included in discontinued operations as of June 30, 2002. We also
recorded an additional impairment charge of $126.4 million in order to write-down its investment in
CIT to fair value for a total CIT goodwill impairment charge of $2,125.4 million for the quarter ended
June 30, 2002. This write-down was based upon net IPO proceeds of approximately $4.4 billion, after
deducting estimated out of pocket expenses, and is included in the $6,282.5 million loss from
discontinued operations. During the fourth quarter of fiscal 2002, Tyco recorded a loss on the sale of
Tyco Capital of $58.8 million.
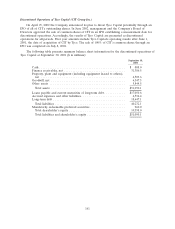
Liquidity and Capital Resources
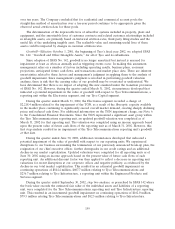
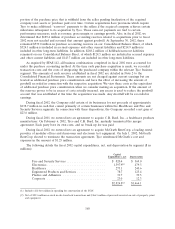
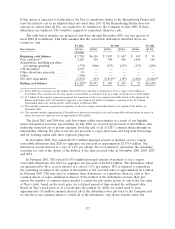
The following table summarizes the sources of our cash flow from operating activities and the use
of a portion of that cash in our operations in fiscal 2002, fiscal 2001 and fiscal 2000. We refer to the
net amount of cash generated from operating activities, less capital expenditures, dividends and
increases or decreases associated with the sale of accounts receivable program, as ‘‘free cash flow.’’
Management believes operating cash flow and free cash flow are important measures of operating
performance. However, free cash flow as determined below is not a measure of financial performance
under GAAP, should not be considered a substitute for cash flows from operating activities as
determined in accordance with GAAP as a measure of liquidity, and may not be comparable to
similarly titled measures reported by other companies.
164