ADT 2002 Annual Report Download - page 144
Download and view the complete annual report
Please find page 144 of the 2002 ADT annual report below. You can navigate through the pages in the report by either clicking on the pages listed below, or by using the keyword search tool below to find specific information within the annual report.-
 1
1 -
2
-
3
-
4
-
5
-
6
-
7
-
8
-
9
-
10
-
11
-
12
-
13
-
14
-
15
-
16
-
17
-
18
-
19
-
20
-
21
-
22
-
23
-
24
-
25
-
26
-
27
-
28
-
29
-
30
-
31
-
32
-
33
-
34
-
35
-
36
-
37
-
38
-
39
-
40
-
41
-
42
-
43
-
44
-
45
-
46
-
47
-
48
-
49
-
50
-
51
-
52
-
53
-
54
-
55
-
56
-
57
-
58
-
59
-
60
-
61
-
62
-
63
-
64
-
65
-
66
-
67
-
68
-
69
-
70
-
71
-
72
-
73
-
74
-
75
-
76
-
77
-
78
-
79
-
80
-
81
-
82
-
83
-
84
-
85
-
86
-
87
-
88
-
89
-
90
-
91
-
92
-
93
-
94
-
95
-
96
-
97
-
98
-
99
-
100
-
101
-
102
-
103
-
104
-
105
-
106
-
107
-
108
-
109
-
110
-
111
-
112
-
113
-
114
-
115
-
116
-
117
-
118
-
119
-
120
-
121
-
122
-
123
-
124
-
125
-
126
-
127
-
128
-
129
-
130
-
131
-
132
-
133
-
 134
134 -
 135
135 -
 136
136 -
 137
137 -
 138
138 -
 139
139 -
 140
140 -
 141
141 -
 142
142 -
 143
143 -
 144
144 -
 145
145 -
 146
146 -
 147
147 -
 148
148 -
 149
149 -
 150
150 -
 151
151 -
 152
152 -
 153
153 -
 154
154 -
155
-
156
-
157
-
158
-
159
-
160
-
161
-
162
-
163
-
164
-
165
-
166
-
167
-
168
-
169
-
170
-
171
-
172
-
173
-
174
-
175
-
176
-
177
-
178
-
179
-
180
-
181
-
182
 |
 |

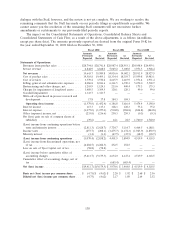
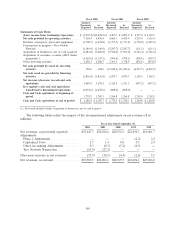
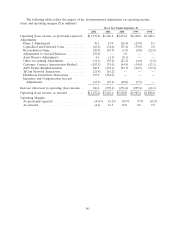
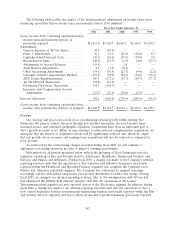
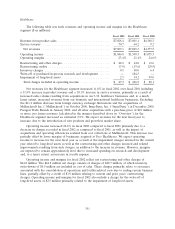
The following tables reflect the impact of the aforementioned adjustments on income (loss) from
continuing operations before income taxes and minority interest ($ in millions):
Fiscal Year Ended September 30,
2002 2001 2000 1999 1998
(Loss) income from continuing operations before
income taxes and minority interest, as
previously reported .................... $(2,811.3) $5,724.7 $6,464.5 $1,641.5 $1,699.2
Adjustments:
Gain on Issuance of TyCom Shares ......... 39.6 (39.6) — — —
Phase 2 Adjustments ................... 36.1 13.0 (26.4) (29.8) 8.1
Capitalized and Deferred Costs ........... (43.2) (34.6) (39.2) (59.0) 2.8
Reconciliation Items ................... (20.0) (47.7) (1.9) (8.0) (22.5)
Adjustments to Accrual Balances .......... (19.6) — 1.8 — —
Asset Reserve Adjustments ............... 4.6 (1.5) (8.1) — —
Other Accounting Adjustments ............ (14.1) (35.4) (23.2) (4.4) (2.2)
Customer Contract Amortization Method .... (107.3) (74.5) (54.9) (34.0) (13.1)
ADT Dealer Reimbursements ............ 186.9 (172.1) (93.7) (64.7) (37.2)
TyCom Network Transaction .............. (21.4) (16.2) — — —
Healthcare Divestiture Transaction ......... 154.3 (154.3) — — —
Insurance and Compensation Accrual
Adjustments ........................ (13.3) (47.1) (30.8) (5.5) —
Increase (decrease) ...................... 182.6 (610.0) (276.4) (205.4) (64.1)
(Loss) income from continuing operations before
income taxes and minority interest, as restated $(2,628.7) $5,114.7 $6,188.1 $1,436.1 $1,635.1
Overview
Our strategy and near-term actions focus on enhancing internal growth within existing Tyco
businesses. We plan to achieve this goal through new product innovation, increased market share,
increased service and continued geographic expansion. Acquisitions have been an important part of
Tyco’s growth in recent years. While we may continue to make selected complementary acquisitions, we
anticipate that the amount of acquisition activity will be significantly reduced, and, therefore, expect
that our growth rate in revenues and earnings from acquisitions will also be reduced as compared to
prior periods.
As evidenced by the restructuring charges recorded during fiscal 2002, we will continue to
implement cost-cutting initiatives in order to improve earnings and margins.
Information for all periods presented below reflects the grouping of Tyco’s businesses into five
segments, consisting of Fire and Security Services, Electronics, Healthcare, Engineered Products and
Services, and Plastics and Adhesives. During fiscal 2003, a change was made to the Company’s internal
reporting structure such that the operations of Tyco’s plastics and adhesives businesses (previously
reported within the Healthcare and Specialty Products segment) now comprise the Company’s new
Plastics and Adhesives reportable segment. The Company has conformed its segment reporting
accordingly and has reclassified comparative prior period information to reflect this change. During
fiscal 2002, we changed our internal reporting structure (due to the amalgamation with TyCom Ltd.
that eliminated the publicly held minority interest) such that the operations of the former
Telecommunications segment are now reported as part of the Electronics segment. In addition, during
fiscal 2002, a change was made to our internal reporting structure such that the operations of Tyco’s
flow control businesses and the environmental engineering business (previously reported within the Fire
and Security Services segment) and Tyco’s electrical and metal products business (previously reported
142