ADT 2002 Annual Report Download - page 171
Download and view the complete annual report
Please find page 171 of the 2002 ADT annual report below. You can navigate through the pages in the report by either clicking on the pages listed below, or by using the keyword search tool below to find specific information within the annual report.-
 1
1 -
2
-
3
-
4
-
5
-
6
-
7
-
8
-
9
-
10
-
11
-
12
-
13
-
14
-
15
-
16
-
17
-
18
-
19
-
20
-
21
-
22
-
23
-
24
-
25
-
26
-
27
-
28
-
29
-
30
-
31
-
32
-
33
-
34
-
35
-
36
-
37
-
38
-
39
-
40
-
41
-
42
-
43
-
44
-
45
-
46
-
47
-
48
-
49
-
50
-
51
-
52
-
53
-
54
-
55
-
56
-
57
-
58
-
59
-
60
-
61
-
62
-
63
-
64
-
65
-
66
-
67
-
68
-
69
-
70
-
71
-
72
-
73
-
74
-
75
-
76
-
77
-
78
-
79
-
80
-
81
-
82
-
83
-
84
-
85
-
86
-
87
-
88
-
89
-
90
-
91
-
92
-
93
-
94
-
95
-
96
-
97
-
98
-
99
-
100
-
101
-
102
-
103
-
104
-
105
-
106
-
107
-
108
-
109
-
110
-
111
-
112
-
113
-
114
-
115
-
116
-
117
-
118
-
119
-
120
-
121
-
122
-
123
-
124
-
125
-
126
-
127
-
128
-
129
-
130
-
131
-
132
-
133
-
134
-
135
-
136
-
137
-
138
-
139
-
140
-
141
-
142
-
143
-
144
-
145
-
146
-
147
-
148
-
149
-
150
-
151
-
152
-
153
-
154
-
155
-
156
-
157
-
158
-
159
-
160
-
 161
161 -
 162
162 -
 163
163 -
 164
164 -
 165
165 -
 166
166 -
 167
167 -
 168
168 -
 169
169 -
 170
170 -
 171
171 -
 172
172 -
 173
173 -
 174
174 -
 175
175 -
 176
176 -
 177
177 -
 178
178 -
 179
179 -
 180
180 -
 181
181 -
182
 |
 |
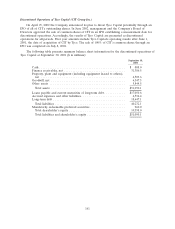
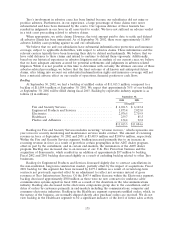
We continue to fund capital expenditures to improve the cost structure of our businesses, to invest
in new processes and technology, and to maintain high quality production standards. The level of
capital expenditures for the Fire and Security Services segment significantly exceeded, and is expected
to continue to exceed, depreciation due to growth in the number of new security system installations.
During fiscal 2002, we spent $1,146.0 million on construction of the TGN. Construction of the TGN
was substantially completed during fiscal 2002. Consequently, the level of capital expenditures in the
Electronics segment is expected to decrease significantly in fiscal 2003. The level of capital expenditures
in the other segments should not exceed depreciation in fiscal 2003 and approximate the level of
spending in fiscal 2002.
The provision for income taxes relating to continuing operations in the Consolidated Statement of
Operations for fiscal 2002 was $208.1 million, and the amount of income taxes paid (net of refunds)
during the year was $368.1 million. The difference is due to timing differences, as well as the tax
benefits related to the exercise of share options. The current income tax liability at September 30, 2002
was $2,219.1 million, as compared to $1,845.2 million at September 30, 2001.
During fiscal 2002, we received proceeds of $185.7 million from the exercise of common share
options and used $789.2 million of cash to repurchase our own common shares. Other than to satisfy
the pre-existing put option rights associated with the acquisition of Sensormatic, we ceased
repurchasing our common shares and will not consider implementing future repurchases until our
short-term debt levels are significantly reduced.
Capitalization
Shareholders’ equity was $24,081.3 million, or $12.07 per share, at September 30, 2002, compared
to $31,120.6 million, or $16.08 per share, at September 30, 2001. The decrease in shareholders’ equity
was due primarily to a net loss of $9,219.8 million and the repurchase of our common shares discussed
above. This decrease was partially offset by the following: (i) the issuance of approximately 47.8 million
common shares valued at $1,918.8 million for the acquisition of Sensormatic, (ii) the conversion of
TyCom shares not already owned by Tyco into 17.7 million Tyco common shares valued at
$819.9 million in connection with the amalgamation with TyCom, (iii) the issuance of 44,139 common
shares valued at $2.3 million related to an earn-out payment, and (iv) $42.0 million for the fair value of
options assumed.
Tangible shareholders’ deficit was $7,745.0 million at September 30, 2002 and tangible
shareholders’ equity was $2,922.8 million at September 30, 2001. Goodwill and other intangible assets
were $31,826.3 million at September 30, 2002, compared to $28,197.8 million at September 30, 2001.
Acquisitions have been an important part of Tyco’s growth in recent years. While we may continue to
make selected complementary acquisitions, we anticipate that the amount of acquisition activity will be
significantly reduced and, therefore, our growth rate from acquisitions will continue to be reduced as
compared to prior quarters.
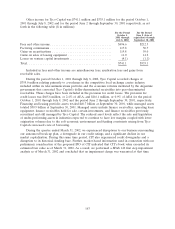
Total debt as a percentage of total capitalization (total debt and shareholders’ equity) was 50% at
September 30, 2002 and 41% at September 30, 2001. Some of our debt agreements, including our bank
credit agreements, contain covenants that would result in a default if our total debt as a percentage of
total capitalization exceeds 52.5%. A significant decline in our shareholders’ equity, including a decline
due to a significant impairment of goodwill or other assets, could cause a default under this covenant.
We had $6.2 billion of cash and cash equivalents as of September 30, 2002. Net debt (total debt less
cash and cash equivalents) as a percent of net capitalization (net debt and shareholders’ equity) was
43% at September 30, 2002 and 39% at September 30, 2001.
The source of the cash used for acquisitions in fiscal 2002 was primarily proceeds from the
issuance of debt. At September 30, 2002, total debt was $24,205.8 million, as compared to total debt
relating to continuing operations of $21,619.0 million at September 30, 2001. This increase resulted
169