ADT 2002 Annual Report Download - page 153
Download and view the complete annual report
Please find page 153 of the 2002 ADT annual report below. You can navigate through the pages in the report by either clicking on the pages listed below, or by using the keyword search tool below to find specific information within the annual report.-
 1
1 -
2
-
3
-
4
-
5
-
6
-
7
-
8
-
9
-
10
-
11
-
12
-
13
-
14
-
15
-
16
-
17
-
18
-
19
-
20
-
21
-
22
-
23
-
24
-
25
-
26
-
27
-
28
-
29
-
30
-
31
-
32
-
33
-
34
-
35
-
36
-
37
-
38
-
39
-
40
-
41
-
42
-
43
-
44
-
45
-
46
-
47
-
48
-
49
-
50
-
51
-
52
-
53
-
54
-
55
-
56
-
57
-
58
-
59
-
60
-
61
-
62
-
63
-
64
-
65
-
66
-
67
-
68
-
69
-
70
-
71
-
72
-
73
-
74
-
75
-
76
-
77
-
78
-
79
-
80
-
81
-
82
-
83
-
84
-
85
-
86
-
87
-
88
-
89
-
90
-
91
-
92
-
93
-
94
-
95
-
96
-
97
-
98
-
99
-
100
-
101
-
102
-
103
-
104
-
105
-
106
-
107
-
108
-
109
-
110
-
111
-
112
-
113
-
114
-
115
-
116
-
117
-
118
-
119
-
120
-
121
-
122
-
123
-
124
-
125
-
126
-
127
-
128
-
129
-
130
-
131
-
132
-
133
-
134
-
135
-
136
-
137
-
138
-
139
-
140
-
141
-
142
-
 143
143 -
 144
144 -
 145
145 -
 146
146 -
 147
147 -
 148
148 -
 149
149 -
 150
150 -
 151
151 -
 152
152 -
 153
153 -
 154
154 -
 155
155 -
 156
156 -
 157
157 -
 158
158 -
 159
159 -
 160
160 -
 161
161 -
 162
162 -
 163
163 -
164
-
165
-
166
-
167
-
168
-
169
-
170
-
171
-
172
-
173
-
174
-
175
-
176
-
177
-
178
-
179
-
180
-
181
-
182
 |
 |

Healthcare
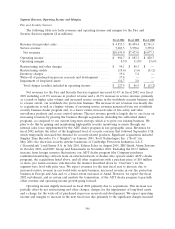
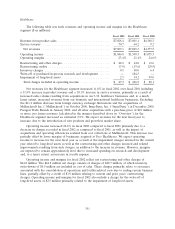
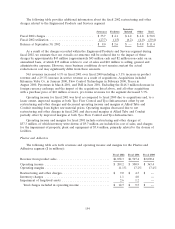
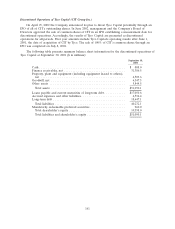
The following table sets forth revenues and operating income and margins for the Healthcare
segment ($ in millions):
Fiscal 2002 Fiscal 2001 Fiscal 2000
Revenue from product sales .............................. $7,828.4 $7,001.1 $4,368.3
Service revenue ....................................... 70.7 64.2 9.2
Net revenues ....................................... $7,899.1 $7,065.3 $4,377.5
Operating income ..................................... $1,846.8 $1,509.3 $1,075.3
Operating margins ..................................... 23.4% 21.4% 24.6%
Restructuring and other charges ........................... $ 48.2 $ 24.0 $ 12.6
Restructuring credits ................................... (3.9) (15.6) (29.9)
Inventory charges ..................................... 0.5 40.0 6.4
Write-off of purchased in-process research and development ...... — 184.3 —
Impairment of long-lived assets ........................... 2.5 14.2 99.0
Total charges included in operating income ................. $ 47.3 $ 246.9 $ 88.1
Net revenues for the Healthcare segment increased 11.8% in fiscal 2002 over fiscal 2001 including
a 11.8% increase in product revenue and a 10.1% increase in service revenue, primarily as a result of
increased sales volume resulting from acquisitions in our U.S. healthcare businesses and, to a much
lesser extent, increased revenues from our domestic and international healthcare businesses. Excluding
the $11.2 million decrease from foreign currency exchange fluctuations and the acquisitions of
Mallinckrodt Inc. (‘‘Mallinckrodt’’) in October 2000, InnerDyne, Inc. (‘‘InnerDyne’’) in December 2000,
Paragon Trade Brands in January 2002, and all other acquisitions with a purchase price of $10 million
or more, pro forma revenues (calculated in the manner described above in ‘‘Overview’’) for the
Healthcare segment increased an estimated 2.9%. We expect revenues for the next fiscal year to
increase, due to the introduction of new products and growth in market share.
Operating income increased 22.4% in fiscal 2002 compared to fiscal 2001 primarily due to a
decrease in charges recorded in fiscal 2002 as compared to fiscal 2001, as well as the impact of
acquisitions and operating efficiencies realized from cost reductions at Mallinckrodt. This increase was
partially offset by lower margins of businesses acquired at Tyco Healthcare. We expect operating
income to increase for the next fiscal year as a result of the impairment charges incurred in the current
year related to long-lived assets as well as the restructuring and other charges incurred and related
improvements resulting from such charges, in addition to the increase in revenue. However, margins
are expected to remain approximately level due to increased spending on research and development
and, to a lesser extent, an increase in royalty expense.
Operating income and margins for fiscal 2002 reflect net restructuring and other charges of
$44.8 million. The $44.8 million net charge consists of charges of $48.7 million, of which inventory
write-downs of $0.5 million are included in cost of sales. These charges primarily relate to severance
associated with the consolidation of operations and facility-related costs due to exiting certain business
lines, partially offset by a credit of $3.9 million relating to current and prior years’ restructuring
charges. Operating income and margins for fiscal 2002 also include a charge for the write-off of
long-lived assets of $2.5 million primarily related to the impairment of long-lived assets.
151