SunTrust 2011 Annual Report Download - page 98
Download and view the complete annual report
Please find page 98 of the 2011 SunTrust annual report below. You can navigate through the pages in the report by either clicking on the pages listed below, or by using the keyword search tool below to find specific information within the annual report.-
 1
1 -
2
-
3
-
4
-
5
-
6
-
7
-
8
-
9
-
10
-
11
-
12
-
13
-
14
-
15
-
16
-
17
-
18
-
19
-
20
-
21
-
22
-
23
-
24
-
25
-
26
-
27
-
28
-
29
-
30
-
31
-
32
-
33
-
34
-
35
-
36
-
37
-
38
-
39
-
40
-
41
-
42
-
43
-
44
-
45
-
46
-
47
-
48
-
49
-
50
-
51
-
52
-
53
-
54
-
55
-
56
-
57
-
58
-
59
-
60
-
61
-
62
-
63
-
64
-
65
-
66
-
67
-
68
-
69
-
70
-
71
-
72
-
73
-
74
-
75
-
76
-
77
-
78
-
79
-
80
-
81
-
82
-
83
-
84
-
85
-
86
-
87
-
 88
88 -
 89
89 -
 90
90 -
 91
91 -
 92
92 -
 93
93 -
 94
94 -
 95
95 -
 96
96 -
 97
97 -
 98
98 -
 99
99 -
 100
100 -
 101
101 -
 102
102 -
 103
103 -
 104
104 -
 105
105 -
 106
106 -
 107
107 -
 108
108 -
109
-
110
-
111
-
112
-
113
-
114
-
115
-
116
-
117
-
118
-
119
-
120
-
121
-
122
-
123
-
124
-
125
-
126
-
127
-
128
-
129
-
130
-
131
-
132
-
133
-
134
-
135
-
136
-
137
-
138
-
139
-
140
-
141
-
142
-
143
-
144
-
145
-
146
-
147
-
148
-
149
-
150
-
151
-
152
-
153
-
154
-
155
-
156
-
157
-
158
-
159
-
160
-
161
-
162
-
163
-
164
-
165
-
166
-
167
-
168
-
169
-
170
-
171
-
172
-
173
-
174
-
175
-
176
-
177
-
178
-
179
-
180
-
181
-
182
-
183
-
184
-
185
-
186
-
187
-
188
-
189
-
190
-
191
-
192
-
193
-
194
-
195
-
196
-
197
-
198
-
199
-
200
-
201
-
202
-
203
-
204
-
205
-
206
-
207
-
208
-
209
-
210
-
211
-
212
-
213
-
214
-
215
-
216
-
217
-
218
-
219
-
220
-
221
-
222
-
223
-
224
-
225
-
226
-
227
 |
 |
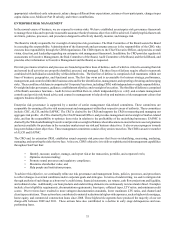
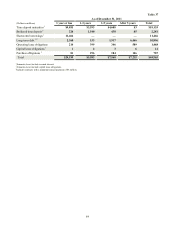
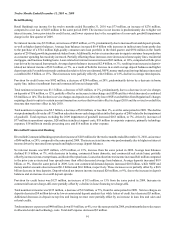
82
Unfunded Lending Commitments
(Dollars in millions)
Unused lines of credit:
Commercial
Mortgage commitments 1
Home equity lines
Commercial real estate
CP conduit
Credit card
Total unused lines of credit
Letters of credit:
Financial standby
Performance standby
Commercial
Total letters of credit
December 31,
2011
$35,685
7,833
12,730
1,465
765
3,526
$62,004
$5,081
70
55
$5,206
Table 36
December 31,
2010
$34,363
9,159
13,557
1,579
1,091
3,561
$63,310
$6,263
108
68
$6,439
1Includes IRLC contracts with notional balances of $4.9 billion and $4.2 billion as of December 31, 2011 and 2010, respectively.
Other Market Risk
Other sources of market risk include the risk associated with holding residential and commercial mortgage loans prior to selling
them into the secondary market, commitments to clients to make mortgage loans that will be sold to the secondary market, and
our investment in MSRs. We manage the risks associated with the residential and commercial mortgage loans classified as held
for sale (i.e., the warehouse) and our IRLCs on residential loans intended for sale. The warehouses and IRLCs consist primarily
of fixed and adjustable rate single family residential and commercial real estate. The risk associated with the warehouses and
IRLCs is the potential change in interest rates between the time the customer locks in the rate on the anticipated loan and the time
the loan is sold on the secondary market, which is typically 60-150 days.
We manage interest rate risk predominantly with interest rate swaps, futures, and forward sale agreements, where the changes in
value of the instruments substantially offset the changes in value of the warehouse and the IRLCs. The IRLCs on residential
mortgage loans intended for sale are classified as free standing derivative financial instruments and are not designated as hedge
accounting relationships.
MSRs are the present value of future net cash flows that are expected to be received from the mortgage servicing portfolio. The
value of MSRs is highly dependent upon the assumed prepayment speed of the mortgage servicing portfolio which is driven by
the level of certain key interest rates, primarily the 30-year current coupon par mortgage rate. Future expected net cash flows from
servicing a loan in the mortgage servicing portfolio would not be realized if the loan pays off earlier than anticipated. The average
prepayment speed for 2011 remained relatively unchanged compared with 2010. There was a slight increase in prepayments toward
the end of the year as mortgage interest rates declined.
MSRs, which are carried at fair value, totaled $921 million and $1.4 billion as of December 31, 2011 and 2010, respectively, are
managed within established risk limits and are monitored as part of various governance processes. We recorded decreases of $733
million and $513 million in the fair value of our MSRs for the years ended December 31, 2011 and 2010, respectively. Increases
or decreases in fair value include the decay resulting from the realization of expected monthly net servicing cash flows. For the
years ended December 31, 2011 and 2010, we originated MSRs with fair values at the time of origination of $224 million and
$289 million, respectively. New originations during 2011 more than offset the decrease in MSR value attributed to decay. An all-
time low in mortgage rates accounted for the majority of the decline in fair value of our MSRs during 2011. Also contributing $38
million to the decline in the fair value of MSRs was an increase in prepayment assumptions attributable to anticipated refinancing
activity from the HARP 2.0 program.
For the years ended December 31, 2011 and 2010, we recorded losses related to MSRs of $161 million and $69 million (including
decay of $200 million and $240 million), respectively, inclusive of the mark to market adjustments on the related hedges. We
continue to evaluate the impact that the Consent Order may have, and we currently do not expect the impact to be material unless
third party price indications reflect lower market valuations.