SunTrust 2011 Annual Report Download - page 62
Download and view the complete annual report
Please find page 62 of the 2011 SunTrust annual report below. You can navigate through the pages in the report by either clicking on the pages listed below, or by using the keyword search tool below to find specific information within the annual report.-
 1
1 -
2
-
3
-
4
-
5
-
6
-
7
-
8
-
9
-
10
-
11
-
12
-
13
-
14
-
15
-
16
-
17
-
18
-
19
-
20
-
21
-
22
-
23
-
24
-
25
-
26
-
27
-
28
-
29
-
30
-
31
-
32
-
33
-
34
-
35
-
36
-
37
-
38
-
39
-
40
-
41
-
42
-
43
-
44
-
45
-
46
-
47
-
48
-
49
-
50
-
51
-
 52
52 -
 53
53 -
 54
54 -
 55
55 -
 56
56 -
 57
57 -
 58
58 -
 59
59 -
 60
60 -
 61
61 -
 62
62 -
 63
63 -
 64
64 -
 65
65 -
 66
66 -
 67
67 -
 68
68 -
 69
69 -
 70
70 -
 71
71 -
 72
72 -
73
-
74
-
75
-
76
-
77
-
78
-
79
-
80
-
81
-
82
-
83
-
84
-
85
-
86
-
87
-
88
-
89
-
90
-
91
-
92
-
93
-
94
-
95
-
96
-
97
-
98
-
99
-
100
-
101
-
102
-
103
-
104
-
105
-
106
-
107
-
108
-
109
-
110
-
111
-
112
-
113
-
114
-
115
-
116
-
117
-
118
-
119
-
120
-
121
-
122
-
123
-
124
-
125
-
126
-
127
-
128
-
129
-
130
-
131
-
132
-
133
-
134
-
135
-
136
-
137
-
138
-
139
-
140
-
141
-
142
-
143
-
144
-
145
-
146
-
147
-
148
-
149
-
150
-
151
-
152
-
153
-
154
-
155
-
156
-
157
-
158
-
159
-
160
-
161
-
162
-
163
-
164
-
165
-
166
-
167
-
168
-
169
-
170
-
171
-
172
-
173
-
174
-
175
-
176
-
177
-
178
-
179
-
180
-
181
-
182
-
183
-
184
-
185
-
186
-
187
-
188
-
189
-
190
-
191
-
192
-
193
-
194
-
195
-
196
-
197
-
198
-
199
-
200
-
201
-
202
-
203
-
204
-
205
-
206
-
207
-
208
-
209
-
210
-
211
-
212
-
213
-
214
-
215
-
216
-
217
-
218
-
219
-
220
-
221
-
222
-
223
-
224
-
225
-
226
-
227
 |
 |

46
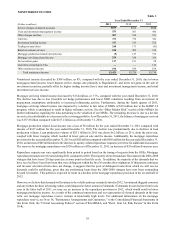
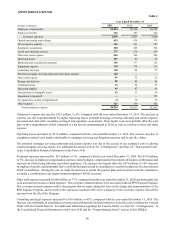
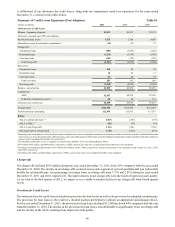
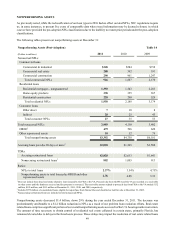
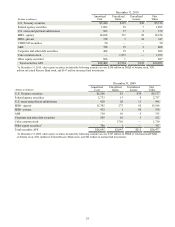
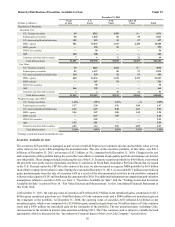
A rollforward of our allowance for credit losses, along with our summarized credit loss experience for the years ended
December 31, is shown in the tables below:
Summary of Credit Losses Experience (Post-Adoption)
(Dollars in millions)
Allowance for Credit Losses
Balance - beginning of period
Allowance recorded upon VIE consolidation
Provision for loan losses
(Benefit)/provision for unfunded commitments 1
Charge-offs:
Commercial loans
Residential loans
Consumer loans
Total charge-offs
Recoveries:
Commercial loans
Residential loans
Consumer loans
Total recoveries
Net charge-offs
Balance - end of period
Components:
ALLL
Unfunded commitments reserve 2
Allowance for credit losses
Average loans
Period-end loans outstanding
Ratios:
ALLL to period-end loans 3,4
ALLL to NPLs 5
ALLL to net charge-offs
Net charge-offs to average loans
2011
$3,032
—
1,523
(10)
(803)
(1,275)
(163)
(2,241)
140
18
43
201
(2,040)
$2,505
$2,457
48
$2,505
$116,308
122,495
2.01%
85%
1.20x
1.75%
2010
$3,235
1
2,708
(57)
(1,087)
(1,736)
(195)
(3,018)
99
20
44
163
(2,855)
$3,032
$2,974
58
$3,032
$113,925
115,975
2.58%
73%
1.04x
2.51%
Table 10
2009
$2,379
—
4,007
87
(1,432)
(1,707)
(259)
(3,398)
84
17
59
160
(3,238)
$3,235
$3,120
115
$3,235
$121,041
113,675
2.76%
59%
0.96x
2.67%
1 Beginning in the fourth quarter of 2009, SunTrust began recording the provision for unfunded commitments within the provision for credit losses in the Consolidated Statements
of Income/(Loss). Given the immateriality of this provision, prior to the fourth quarter of 2009, the provision for unfunded commitments remains classified within other noninterest
expense in the Consolidated Statements of Income/(Loss).
2 The unfunded commitments reserve is separately recorded in other liabilities in the Consolidated Balance Sheets.
3 $433 million, $492 million, and $449 million, respectively, of LHFI carried at fair value were excluded from period-end loans in the calculation.
4 Excluding government-guaranteed loans of $13.9 billion, $8.8 billion, and $3.7 billion, respectively, from period-end loans in the calculation results in ratios of 2.27%, 2.79%,
and 2.84%, respectively.
5 $25 million, $28 million, and $46 million, respectively, of NPLs carried at fair value were excluded from NPLs in the calculation.
Charge-offs
Net charge-offs declined $815 million during the year ended December 31, 2011, down 29% compared with the year ended
December 31, 2010. The decline in net charge-offs occurred across each segment of our loan portfolio and was particularly
notable for residential loans. As a percentage of average loans, net charge-offs were 1.75% and 2.51% during the years ended
December 31, 2011 and 2010, respectively. The improvements in net charge-offs were the result of improved asset quality.
As we look to the first quarter of 2012, we expect to see a stable to modest decline in net charge-offs from fourth quarter
levels.
Provision for Credit Losses
The total provision for credit losses includes the provision for loan losses as well as the provision for unfunded commitments.
The provision for loan losses is the result of a detailed analysis performed to estimate an appropriate and adequate ALLL.
For the year ended December 31, 2011, the provision for loan losses declined $1.2 billion, down 44% compared with the year
ended December 31, 2010. The decline in the provision for loan losses was attributable to significantly lower net charge-offs
and the decline in the ALLL resulting from improved credit quality.