SunTrust 2011 Annual Report Download - page 85
Download and view the complete annual report
Please find page 85 of the 2011 SunTrust annual report below. You can navigate through the pages in the report by either clicking on the pages listed below, or by using the keyword search tool below to find specific information within the annual report.-
 1
1 -
2
-
3
-
4
-
5
-
6
-
7
-
8
-
9
-
10
-
11
-
12
-
13
-
14
-
15
-
16
-
17
-
18
-
19
-
20
-
21
-
22
-
23
-
24
-
25
-
26
-
27
-
28
-
29
-
30
-
31
-
32
-
33
-
34
-
35
-
36
-
37
-
38
-
39
-
40
-
41
-
42
-
43
-
44
-
45
-
46
-
47
-
48
-
49
-
50
-
51
-
52
-
53
-
54
-
55
-
56
-
57
-
58
-
59
-
60
-
61
-
62
-
63
-
64
-
65
-
66
-
67
-
68
-
69
-
70
-
71
-
72
-
73
-
74
-
 75
75 -
 76
76 -
 77
77 -
 78
78 -
 79
79 -
 80
80 -
 81
81 -
 82
82 -
 83
83 -
 84
84 -
 85
85 -
 86
86 -
 87
87 -
 88
88 -
 89
89 -
 90
90 -
 91
91 -
 92
92 -
 93
93 -
 94
94 -
 95
95 -
96
-
97
-
98
-
99
-
100
-
101
-
102
-
103
-
104
-
105
-
106
-
107
-
108
-
109
-
110
-
111
-
112
-
113
-
114
-
115
-
116
-
117
-
118
-
119
-
120
-
121
-
122
-
123
-
124
-
125
-
126
-
127
-
128
-
129
-
130
-
131
-
132
-
133
-
134
-
135
-
136
-
137
-
138
-
139
-
140
-
141
-
142
-
143
-
144
-
145
-
146
-
147
-
148
-
149
-
150
-
151
-
152
-
153
-
154
-
155
-
156
-
157
-
158
-
159
-
160
-
161
-
162
-
163
-
164
-
165
-
166
-
167
-
168
-
169
-
170
-
171
-
172
-
173
-
174
-
175
-
176
-
177
-
178
-
179
-
180
-
181
-
182
-
183
-
184
-
185
-
186
-
187
-
188
-
189
-
190
-
191
-
192
-
193
-
194
-
195
-
196
-
197
-
198
-
199
-
200
-
201
-
202
-
203
-
204
-
205
-
206
-
207
-
208
-
209
-
210
-
211
-
212
-
213
-
214
-
215
-
216
-
217
-
218
-
219
-
220
-
221
-
222
-
223
-
224
-
225
-
226
-
227
 |
 |
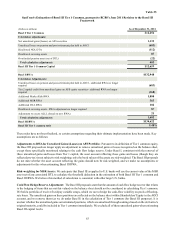
69
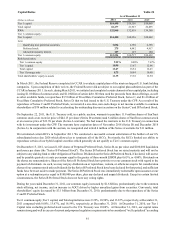
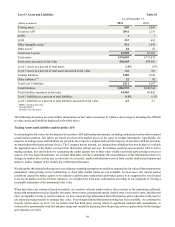
Level 3 Assets and Liabilities
(Dollars in millions)
Trading assets
Securities AFS
LHFS
LHFI
Other intangible assets 1
Other assets 2
Total level 3 assets
Total assets
Total assets measured at fair value
Level 3 assets as a percent of total assets
Level 3 assets as a percent of total assets measured at fair value
Trading liabilities
Other liabilities 2,3
Total level 3 liabilities
Total liabilities
Total liabilities measured at fair value
Level 3 liabilities as a percent of total liabilities
Level 3 liabilities as a percent of total liabilities measured at fair value
1 MSRs carried at fair value
2 Includes IRLCs
3 Includes Visa derivative
As of December 31,
2011
$49
1,041
1
433
921
84
$2,529
$176,859
$38,445
1.4%
6.6
$189
22
$211
$156,793
$4,905
0.1%
4.3
Table 29
2010
$209
1,136
7
492
1,439
18
$3,301
$172,874
$38,410
1.9%
8.6
$145
42
$187
$149,744
$6,842
0.1%
2.7
The following discussion provides further information on fair value accounting by balance sheet category including the difficult
to value assets and liabilities displayed in the table above.
Trading Assets and Liabilities and Securities AFS
In estimating the fair values for the majority of securities AFS and trading instruments, including residual and certain other retained
securitization interests, fair values are based on observable market prices of the same or similar instruments. Specifically, the
majority of trading assets and liabilities are priced by the respective trading desk and the majority of securities AFS are priced by
an independent third party pricing service. The Company has an internal, yet independent validation function in place to evaluate
the appropriateness of the marks received from third party pricing services. For trading securities and securities AFS in active
trading markets, this can be done by comparing the marks against two to three other widely used third party pricing services or
sources. For less liquid instruments, we evaluate third party pricing to determine the reasonableness of the information relative to
changes in market data such as any recent trades we executed, market information received from outside market participants and
analysts, and/or changes in the underlying collateral performance.
We also gather third-party broker quotes or use industry-standard or proprietary models to estimate the fair value of these instruments
particularly when pricing service information or observable market trades are not available. In most cases, the current market
conditions caused the broker quotes to be indicative and the price indications and broker quotes to be supported by very limited
to no recent market activity. In those instances, we weighted the third party information according to our judgment of it being a
reasonable indication of the instrument's fair value.
When fair values are estimated based on models, we consider relevant market indices that correlate to the underlying collateral,
along with assumptions such as liquidity discounts, interest rates, prepayment speeds, default rates, loss severity rates, and discount
rates. As liquidity returns to certain markets, we have more pricing information from third parties and a reduction in the need to
use internal pricing models to estimate fair value. Even though limited third party pricing has been available, we continued to
classify certain assets as level 3 as we believe that this third party pricing relied on significant unobservable assumptions, as
evidenced by a persistently wide bid-ask price range and variability in pricing from the pricing services, particularly for the vintages
and exposures we hold.