SunTrust 2011 Annual Report Download - page 212
Download and view the complete annual report
Please find page 212 of the 2011 SunTrust annual report below. You can navigate through the pages in the report by either clicking on the pages listed below, or by using the keyword search tool below to find specific information within the annual report.-
 1
1 -
2
-
3
-
4
-
5
-
6
-
7
-
8
-
9
-
10
-
11
-
12
-
13
-
14
-
15
-
16
-
17
-
18
-
19
-
20
-
21
-
22
-
23
-
24
-
25
-
26
-
27
-
28
-
29
-
30
-
31
-
32
-
33
-
34
-
35
-
36
-
37
-
38
-
39
-
40
-
41
-
42
-
43
-
44
-
45
-
46
-
47
-
48
-
49
-
50
-
51
-
52
-
53
-
54
-
55
-
56
-
57
-
58
-
59
-
60
-
61
-
62
-
63
-
64
-
65
-
66
-
67
-
68
-
69
-
70
-
71
-
72
-
73
-
74
-
75
-
76
-
77
-
78
-
79
-
80
-
81
-
82
-
83
-
84
-
85
-
86
-
87
-
88
-
89
-
90
-
91
-
92
-
93
-
94
-
95
-
96
-
97
-
98
-
99
-
100
-
101
-
102
-
103
-
104
-
105
-
106
-
107
-
108
-
109
-
110
-
111
-
112
-
113
-
114
-
115
-
116
-
117
-
118
-
119
-
120
-
121
-
122
-
123
-
124
-
125
-
126
-
127
-
128
-
129
-
130
-
131
-
132
-
133
-
134
-
135
-
136
-
137
-
138
-
139
-
140
-
141
-
142
-
143
-
144
-
145
-
146
-
147
-
148
-
149
-
150
-
151
-
152
-
153
-
154
-
155
-
156
-
157
-
158
-
159
-
160
-
161
-
162
-
163
-
164
-
165
-
166
-
167
-
168
-
169
-
170
-
171
-
172
-
173
-
174
-
175
-
176
-
177
-
178
-
179
-
180
-
181
-
182
-
183
-
184
-
185
-
186
-
187
-
188
-
189
-
190
-
191
-
192
-
193
-
194
-
195
-
196
-
197
-
198
-
199
-
200
-
201
-
 202
202 -
 203
203 -
 204
204 -
 205
205 -
 206
206 -
 207
207 -
 208
208 -
 209
209 -
 210
210 -
 211
211 -
 212
212 -
 213
213 -
 214
214 -
 215
215 -
 216
216 -
 217
217 -
 218
218 -
 219
219 -
 220
220 -
 221
221 -
 222
222 -
223
-
224
-
225
-
226
-
227
 |
 |

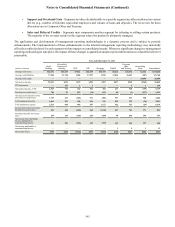
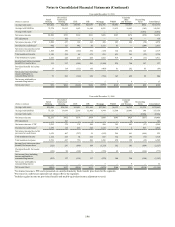
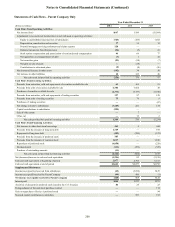
Notes to Consolidated Financial Statements (Continued)
196
(Dollars in millions)
Average total assets
Average total liabilities
Average total equity
Net interest income
FTE adjustment
Net interest income - FTE 1
Provision for credit losses 2
Net interest income/(loss) after
provision for credit losses
Total noninterest income
Total noninterest expense
Income/(loss) before provision/
(benefit) for income taxes
Provision/(benefit) for income
taxes 3
Net income/(loss) including
income attributable to
noncontrolling interest
Net income attributable to
noncontrolling interest
Net income/(loss)
Year ended December 31, 2010
Retail
Banking
$39,204
75,574
—
$2,500
—
2,500
992
1,508
1,129
2,526
111
38
73
—
$73
Year ended December 31, 2009
Retail
Banking
$39,249
73,128
—
$2,295
—
2,295
1,236
1,059
1,152
2,536
(325)
(122)
(203)
—
($203)
Diversified
Commercial
Banking
$24,862
20,815
—
$552
105
657
127
530
235
448
317
114
203
—
$203
Diversified
Commercial
Banking
$26,766
19,939
—
$472
107
579
112
467
247
467
247
90
157
—
$157
CRE
$10,743
1,662
—
$162
—
162
442
(280)
88
469
(661)
(332)
(329)
—
($329)
CRE
$13,631
2,398
—
$178
—
178
435
(257)
94
730
(893)
(302)
(591)
—
($591)
CIB
$20,039
16,146
—
$381
1
382
50
332
672
498
506
186
320
—
$320
CIB
$21,416
12,400
—
$304
2
306
248
58
616
486
188
71
117
—
$117
Mortgage
$34,791
4,031
—
$458
—
458
1,183
(725)
521
1,065
(1,269)
(483)
(786)
1
($787)
Mortgage
$37,295
3,944
—
$500
—
500
1,125
(625)
687
1,389
(1,327)
(355)
(972)
3
($975)
W&IM
$9,085
11,935
—
$385
—
385
61
324
821
919
226
81
145
7
$138
W&IM
$9,133
11,560
—
$345
—
345
79
266
754
858
162
62
100
—
$100
Corporate
Other
and Treasury
$32,827
19,483
—
$474
10
484
—
484
295
19
760
262
498
9
$489
Corporate
Other
and Treasury
26,713
29,641
—
$429
14
443
2
441
192
128
505
115
390
9
$381
Reconciling
Items
$824
(105)
22,834
($58)
—
(58)
(204)
146
(32)
(33)
147
65
82
—
$82
Reconciling
Items
$1,239
146
22,286
($57)
—
(57)
827
(884)
(32)
(32)
(884)
(334)
(550)
—
($550)
Consolidated
$172,375
149,541
22,834
$4,854
116
4,970
2,651
2,319
3,729
5,911
137
(69)
206
17
$189
Consolidated
$175,442
153,156
22,286
$4,466
123
4,589
4,064
525
3,710
6,562
(2,327)
(775)
(1,552)
12
($1,564)
1Net interest income is FTE and is presented on a matched maturity funds transfer price basis for the segments.
2Provision for credit losses represents net charge-offs for the segments.
3Includes regular income tax provision/(benefit) and taxable-equivalent income adjustment reversal.