SunTrust 2011 Annual Report Download - page 93
Download and view the complete annual report
Please find page 93 of the 2011 SunTrust annual report below. You can navigate through the pages in the report by either clicking on the pages listed below, or by using the keyword search tool below to find specific information within the annual report.-
 1
1 -
2
-
3
-
4
-
5
-
6
-
7
-
8
-
9
-
10
-
11
-
12
-
13
-
14
-
15
-
16
-
17
-
18
-
19
-
20
-
21
-
22
-
23
-
24
-
25
-
26
-
27
-
28
-
29
-
30
-
31
-
32
-
33
-
34
-
35
-
36
-
37
-
38
-
39
-
40
-
41
-
42
-
43
-
44
-
45
-
46
-
47
-
48
-
49
-
50
-
51
-
52
-
53
-
54
-
55
-
56
-
57
-
58
-
59
-
60
-
61
-
62
-
63
-
64
-
65
-
66
-
67
-
68
-
69
-
70
-
71
-
72
-
73
-
74
-
75
-
76
-
77
-
78
-
79
-
80
-
81
-
82
-
 83
83 -
 84
84 -
 85
85 -
 86
86 -
 87
87 -
 88
88 -
 89
89 -
 90
90 -
 91
91 -
 92
92 -
 93
93 -
 94
94 -
 95
95 -
 96
96 -
 97
97 -
 98
98 -
 99
99 -
 100
100 -
 101
101 -
 102
102 -
 103
103 -
104
-
105
-
106
-
107
-
108
-
109
-
110
-
111
-
112
-
113
-
114
-
115
-
116
-
117
-
118
-
119
-
120
-
121
-
122
-
123
-
124
-
125
-
126
-
127
-
128
-
129
-
130
-
131
-
132
-
133
-
134
-
135
-
136
-
137
-
138
-
139
-
140
-
141
-
142
-
143
-
144
-
145
-
146
-
147
-
148
-
149
-
150
-
151
-
152
-
153
-
154
-
155
-
156
-
157
-
158
-
159
-
160
-
161
-
162
-
163
-
164
-
165
-
166
-
167
-
168
-
169
-
170
-
171
-
172
-
173
-
174
-
175
-
176
-
177
-
178
-
179
-
180
-
181
-
182
-
183
-
184
-
185
-
186
-
187
-
188
-
189
-
190
-
191
-
192
-
193
-
194
-
195
-
196
-
197
-
198
-
199
-
200
-
201
-
202
-
203
-
204
-
205
-
206
-
207
-
208
-
209
-
210
-
211
-
212
-
213
-
214
-
215
-
216
-
217
-
218
-
219
-
220
-
221
-
222
-
223
-
224
-
225
-
226
-
227
 |
 |

77
We are also exposed to market risk in our trading instruments carried at fair value. ALCO meets regularly and is responsible for
reviewing our open positions and establishing policies to monitor and limit exposure to market risk. The policies established by
ALCO are reviewed and approved by our Board.
Market Risk from Non-Trading Activities
The primary goal of interest rate risk management is to control exposure to interest rate risk, both within policy limits approved
by the Board and within narrower guidelines established by ALCO. These limits and guidelines reflect our tolerance for interest
rate risk over both short-term and long-term horizons.
The major sources of our non-trading interest rate risk are timing differences in the maturity and repricing characteristics of assets
and liabilities, changes in the shape of the yield curve, and the potential exercise of explicit or embedded options. We measure
these risks and their impact by identifying and quantifying exposures through the use of sophisticated simulation and valuation
models.
One of the primary methods that we use to quantify and manage interest rate risk is simulation analysis, which is used to model
net interest income from assets, liabilities, and derivative positions under various interest rate scenarios and balance sheet structures.
This analysis measures the sensitivity of net interest income over a two year time horizon. Key assumptions in the simulation
analysis (and in the valuation analysis discussed below) relate to the behavior of interest rates and spreads, the changes in product
balances and the behavior of loan and deposit clients in different rate environments. This analysis incorporates several assumptions,
the most material of which relate to the repricing characteristics and balance fluctuations of deposits with indeterminate or non-
contractual maturities.
As the future path of interest rates cannot be known in advance, we use simulation analysis to project net interest income under
various interest rate scenarios including implied forward and deliberately extreme and perhaps unlikely scenarios. The analyses
may include rapid and gradual ramping of interest rates, rate shocks, basis risk analysis, and yield curve twists. Each analysis
incorporates what management believes to be the most appropriate assumptions about client behavior in an interest rate scenario.
Specific strategies are also analyzed to determine their impact on net interest income levels and sensitivities.
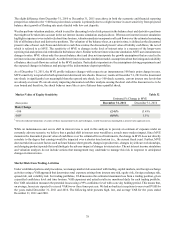
The sensitivity analysis included below is measured as a percentage change in net interest income due to an instantaneous 100
basis point move in benchmark interest rates. Estimated changes set forth below are dependent upon material assumptions such
as those previously discussed. The net interest income profile reflects a relatively neutral interest rate sensitive position with respect
to an instantaneous 100 basis point change in rates.
Interest Rate Sensitivity from an Economic Perspective
(Basis points)
Rate Change
+100
-1001
Estimated % Change in Net Interest Income
Over 12 Months
December 31, 2011
1.5%
(1.8)%
Table 30
December 31, 2010
0.2%
(0.9)%
1 Given the inherent limitations of certain of these measurement tools and techniques, results become less meaningful as interest rates approach zero.
The recognition of interest rate sensitivity from an economic perspective (above) is different from a financial reporting perspective
(below) due to certain interest rate swaps that are used as economic hedges for fixed rate debt. The above profile includes the
recognition of the net interest payments from these swaps, while the profile below does not include the net interest payments. The
swaps are accounted for as trading assets and therefore, the benefit to income due to a decline in short term interest rates will be
recognized as a gain in the fair value of the swaps and will be recorded as an increase in trading income(loss) from a financial
reporting perspective.
Interest Rate Sensitivity from a Financial Reporting Perspective
(Basis points)
Rate Change
+100
-1001
Estimated % Change in Net Interest Income
Over 12 Months
December 31, 2011
1.8%
(2.0)%
Table 31
December 31, 2010
0.5%
(1.0)%
1 Given the inherent limitations of certain of these measurement tools and techniques, results become less meaningful as interest rates approach zero.