SunTrust 2011 Annual Report Download - page 167
Download and view the complete annual report
Please find page 167 of the 2011 SunTrust annual report below. You can navigate through the pages in the report by either clicking on the pages listed below, or by using the keyword search tool below to find specific information within the annual report.-
 1
1 -
2
-
3
-
4
-
5
-
6
-
7
-
8
-
9
-
10
-
11
-
12
-
13
-
14
-
15
-
16
-
17
-
18
-
19
-
20
-
21
-
22
-
23
-
24
-
25
-
26
-
27
-
28
-
29
-
30
-
31
-
32
-
33
-
34
-
35
-
36
-
37
-
38
-
39
-
40
-
41
-
42
-
43
-
44
-
45
-
46
-
47
-
48
-
49
-
50
-
51
-
52
-
53
-
54
-
55
-
56
-
57
-
58
-
59
-
60
-
61
-
62
-
63
-
64
-
65
-
66
-
67
-
68
-
69
-
70
-
71
-
72
-
73
-
74
-
75
-
76
-
77
-
78
-
79
-
80
-
81
-
82
-
83
-
84
-
85
-
86
-
87
-
88
-
89
-
90
-
91
-
92
-
93
-
94
-
95
-
96
-
97
-
98
-
99
-
100
-
101
-
102
-
103
-
104
-
105
-
106
-
107
-
108
-
109
-
110
-
111
-
112
-
113
-
114
-
115
-
116
-
117
-
118
-
119
-
120
-
121
-
122
-
123
-
124
-
125
-
126
-
127
-
128
-
129
-
130
-
131
-
132
-
133
-
134
-
135
-
136
-
137
-
138
-
139
-
140
-
141
-
142
-
143
-
144
-
145
-
146
-
147
-
148
-
149
-
150
-
151
-
152
-
153
-
154
-
155
-
156
-
 157
157 -
 158
158 -
 159
159 -
 160
160 -
 161
161 -
 162
162 -
 163
163 -
 164
164 -
 165
165 -
 166
166 -
 167
167 -
 168
168 -
 169
169 -
 170
170 -
 171
171 -
 172
172 -
 173
173 -
 174
174 -
 175
175 -
 176
176 -
 177
177 -
178
-
179
-
180
-
181
-
182
-
183
-
184
-
185
-
186
-
187
-
188
-
189
-
190
-
191
-
192
-
193
-
194
-
195
-
196
-
197
-
198
-
199
-
200
-
201
-
202
-
203
-
204
-
205
-
206
-
207
-
208
-
209
-
210
-
211
-
212
-
213
-
214
-
215
-
216
-
217
-
218
-
219
-
220
-
221
-
222
-
223
-
224
-
225
-
226
-
227
 |
 |

Notes to Consolidated Financial Statements (Continued)
151
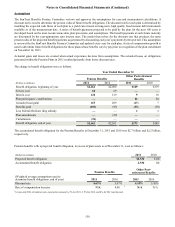
The change in plan assets were as follows:
(Dollars in millions)
Fair value of plan assets, beginning of year
Actual return on plan assets
Employer contributions
Plan participants’ contributions
Benefits paid
Fair value of plan assets, end of year
Year Ended December 31
Pension Benefits
2011
$2,522
129
8
—
(109)
$2,550
2010
$2,334
276
7
—
(95)
$2,522
Other Postretirement Benefits
2011
$165
7
—
22
(33)
$161
2010
$161
13
1
20
(30)
$165
Employer contributions indicated under pension benefits represent the benefits that were paid to nonqualified plan participants.
SERPs are not funded through plan assets.
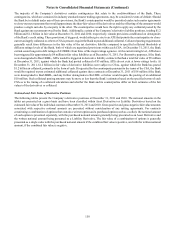
The fair value of plan assets is measured based on the fair value hierarchy which is discussed in Note 19, “Fair Value Election
and Measurement.” The valuations are based on third party data received as of the balance sheet date. Level 1 assets such as
equity securities, mutual funds, and REITs are instruments that are traded in active markets and are valued based on identical
instruments. Fixed income securities and common and collective trust funds are classified as level 2 assets because there is not
an identical asset in the market upon which to base the valuation; however, there are no significant unobservable assumptions
used to value level 2 instruments. The common and collective funds are valued each business day at its reported net asset value,
as determined by the issuer, based on the underlying assets of the fund. Corporate and foreign bonds are valued based on quoted
market prices obtained from external pricing sources where trading in an active market exists for level 2 assets. Level 3 assets
primarily consist of private placement and noninvestment grade bonds. Limited visible market activity exists for these instruments
or similar instruments and therefore significant unobservable assumptions are used to value the securities. In 2009, private
placements were classified as level 3 assets; however, at the end of 2010, these were transferred to level 2 assets due to improved
market conditions.
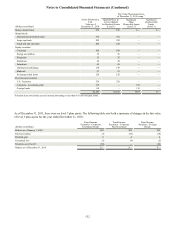
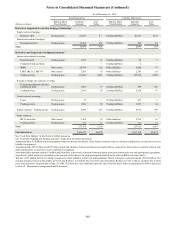
The following tables sets forth by level, within the fair value hierarchy, plan assets related to Pension Benefits at fair value as of
December 31, 2011 and 2010:
(Dollars in millions)
Money market funds
Mutual funds:
International diversified funds
Large cap funds
Small and mid cap funds
Equity securities:
Consumer
Energy and utilities
Financials
Healthcare
Industrials
Information technology
Materials
Exchange traded funds
Fixed income securities:
U.S. Treasuries
Corporate - investment grade
Foreign bonds
Assets Measured at
Fair Value as of
December 31, 2011
$45
351
426
214
107
48
21
58
62
136
17
116
435
398
103
$2,537
Fair Value Measurements as
of December 31, 2011 using 1
Quoted Prices In
Active Markets for
Identical Assets
(Level 1)
$45
351
426
214
107
48
21
58
62
136
17
116
435
—
—
$2,036
Significant
Other
Observable Inputs
(Level 2)
$—
—
—
—
—
—
—
—
—
—
—
—
—
398
103
$501
Significant
Unobservable
Inputs
(Level 3)
$—
—
—
—
—
—
—
—
—
—
—
—
—
—
—
$—
1Schedule does not include accrued income amounting to less than 0.5% of total plan assets.